
一、 MRTG部署手册
1,在192.168.10.110上安装apache,net-snmp;(192.168.10.110为linux服务器)
2,首先确保要刷流量的机器192.168.10.102(该机器系统为2003)安装了snmp协议,并且在snmp services 属性中将团体名称改为public,将192.168.10.110添加到 接受来自这些主机的snmp数据包;在代理选项里面将 5个服务都勾选;重启192.168.10.102的snmp服务;


3,在192.168.10.110上 修改/etc/snmp/snmpd.conf 具体修改内容如下:
1)
# sec.name source community
#com2sec paranoid default public
com2sec readonly default public ###将public加入paranoid 这个组;(定义团体名称为public ,和192.168.10.102一致)
# sec.model sec.name
group MyROSystem v1 paranoid ###定义安全用户名paranoid 映射到MyROSsystem组。
group MyROSystem v2c paranoid
group MyROSystem usm paranoid
# incl/excl subtree mask
view all included .1 80
view mib included .iso.org.dod.internet.mgmt.mib-2 fc
view system included .1.3.6.1.2.1.2.2.1.16.2 表示定义snmp可以查看的一些设备的oid值,比如view system included .1.3.6.1.2.1.2 这行的意思就是监控本机器的网口流量,我们也可以使用snmptranslate来查看OID值所对应的具体内容,比如snmptranslate .1.3.6.1.2.1.2 出来就是 IF-MIB::interfaces 表示端口的信息。
4.在192.168.10.110上apache的配置文档里面指明mrtg生成的图片目录,也就是mrtg的cfg文件里的workdir目录: 这里我们写的是/var/www/
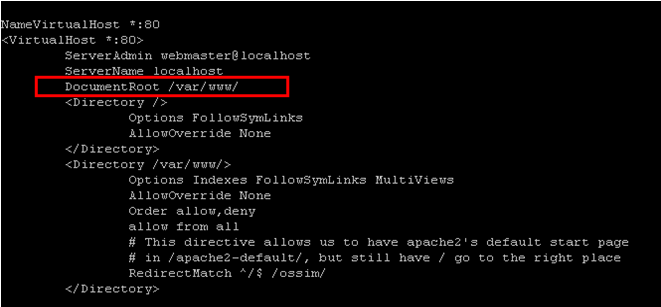
/etc/apache2/sites-available# more default
NameVirtualHost *:80
<VirtualHost *:80>
ServerAdmin webmaster@localhost
ServerName localhost
DocumentRoot /var/www/
<Directory />
5,在192.168.10.100的/var/www/mrtg下 建立一个192.168.10.102的目录;建一个cfg文件,(所谓的cfg文件就是mrtg抓取信息的配置文件)这里我们就取名192.168.10.102
具体内容如下:(这里是刷的2003服务器的配置,如果是刷linux服务器的话,配置有所不同)

6,192.168.10.102的配置文档如下:
Options[_]: growright, bits ###growright 表示从右边生成图片
WorkDir: /var/www/mrtg/192.168.10.102 ###工作目录
LoadMIBs: /usr/share/snmp/mibs/UCD-SNMP-MIB.txt,/usr/share/snmp/mibs/HOST-RESOURCES-MIB.txt,/usr/share/snmp/mibs/TCP-MIB.txt ###调取mib库文件
EnableIPv6: no
#--eth0 ####刷新端口流量
Target[eth0]: /192.168.10.102:public@192.168.10.102: ####Target:是要执行的脚本
Xsize[eth0]: 360 ####生成图表的横向宽度(最大600)
MaxBytes[eth0]: 125000000000 ####图表纵向数值的最大上限,如果此值小于LegendI,则输出的LegendI等于Legendo,Legendo则等于零!
Title[eth0]: eth0 @ 192.168.10.102 ###标题
Options[eth0]: growright, nopercent, nolegend, nobanner, unknaszero, bits ###图标的一些参数,growright表示图标向右延展,nopercent不显示百分比,
PageTop[eth0]: <h1>eth0 @ 192.168.10.102 </h1> ###页面上面的提示
YLegend[eth0]: traffic (b/s) ###图表纵向显示
ShortLegend[eth0]: bits/s ###可看作单位,默认是’b/s’,这个在最大值,平均值,当前值显示时用到
LegendI[eth0]: In/s: ###图标中的颜色值说明语句
LegendO[eth0]: Out/s:
Legend1[eth0]: In/s
Legend2[eth0]: Out/s
# CPU
Target[CPU]: 1.3.6.1.2.1.25.3.3.1.2.2&1.3.6.1.2.1.25.3.3.1.2.3:public@192.168.10.102
Xsize[CPU]: 360
MaxBytes[CPU]:100
Options[CPU]:gauge,unknaszero
WithPeak[CPU]:wmy
YLegend[CPU]:%utilization
ShortLegend[CPU]:%
Legend1[CPU]:Proc Load in next minute
Legend2[CPU]:
Legend3[CPU]:Maximal 5 minute Proc Load
Legend4[CPU]:
LegendI[CPU]:CPU1:
LegendO[CPU]:CPU2:
Title[CPU]:CPU 负荷
PageTop[CPU]:CPU负荷
#memory
Target[server.memoryUsed]: .1.3.6.1.2.1.25.2.3.1.6.3&.1.3.6.1.2.1.25.2.3.1.6.4:public@192.168.10.102 / .1.3.6.1.2.1.25.2.3.1.5.3&.1.3.6.1.2.1.25.2.3.1.5.4:public@192.168.10.102 * 100
Title[server.memoryUsed]: Memory Used
PageTop[server.memoryUsed]: <H1>内存使用率 192.168.10.102</H1>
MaxBytes[server.memoryUsed]: 204800000
ShortLegend[server.memoryUsed]: %
Xsize[server.memoryUsed]: 360
YLegend[server.memoryUsed]: % Memory Used
Legend1[server.memoryUsed]: Vir in next minute
Legend2[server.memoryUsed]: Phy in next minute
Legend3[server.memoryUsed]: Maximal 5 Minute Vir
Legend4[server.memoryUsed]: Maximal 5 Minute Phy
LegendI[server.memoryUsed]: 内存第一个
LegendO[server.memoryUsed]: 内存第二个
Options[server.memoryUsed]: growright,nopercent,gauge
#tcp
Target[tcpopen]: .1.3.6.1.2.1.6.9.0&.1.3.6.1.2.1.6.9.0:public@192.168.10.102
Xsize[tcpopen]: 360
#Unscaled[tcpopen]: ymw
#Suppress[tcpopen]: ymw
MaxBytes[tcpopen]: 65535
Title[tcpopen]: Tcpopen @ 192.168.10.102
Options[tcpopen]: growright, nopercent, nolegend, nobanner, unknaszero,gauge
PageTop[tcpopen]: <h1> TCP连接数 @ 192.168.10.102</h1>
YLegend[tcpopen]: number
ShortLegend[tcpopen]: number
LegendI[tcpopen]: 最大;
LegendO[tcpopen]: 当前;
#disk
Target[server.storageUsed]: .1.3.6.1.2.1.25.2.3.1.6.1&.1.3.6.1.2.1.25.2.3.1.6.2:public@192.168.10.102 / .1.3.6.1.2.1.25.2.3.1.5.1&.1.3.6.1.2.1.25.2.3.1.5.1:public@192.168.10.102 * 100
Xsize[server.storageUsed]: 360
Title[server.storageUsed]: Disk Used
PageTop[server.storageUsed]: <H1>硬盘使用率 192.168.10.102</H1>
MaxBytes[server.storageUsed]: 523444000
ShortLegend[server.storageUsed]: %
YLegend[server.storageUsed]: % Disk Used
Legend1[server.storageUsed]: C: in next minute
Legend2[server.storageUsed]: D: in next minute
Legend3[server.storageUsed]: Maximal 5 Minute C:
Legend4[server.storageUsed]: Maximal 5 Minute D:
LegendI[server.storageUsed]: C盘使用率:
LegendO[server.storageUsed]: D盘使用率:
Options[server.storageUsed]: growright,nopercent,gauge
6,cfg配置文件写好,我们就可以 先执行
indexmaker --output=/var/www/mrtg/192.168.10.102/index.html /var/www/mrtg/192.168.10.102/192.168.10.102
表示通过cfg文件生成的图片在 index.html上显示
7,执行env LANG=C /usr/bin/mrtg /var/www/mrtg/192.168.10.102/192.168.10.102
一般执行第一次会出错,执行3次之后就没有报错了。
8,现在我们就可以打开/var/www/mrtg/192.168.10.102/index.html 看到我们需要抓取的数据已经做成图标显示了。
9,在/var/www/mrtg/ 下创建crond.sh
内容为:
env LANG=C /usr/bin/mrtg /var/www/mrtg/ftp/mrtg.cfg
env LANG=C /usr/bin/mrtg /var/www/mrtg/192.168.10.102/192.168.10.102
再执行 chmod 775 crond.sh
10,再添加crontab –e
*/2 * * * * /var/www/mrtg/crond.sh
保存退出
这样就实现每2分钟刷新一次
如果要添加一台新的机器监控:比如IP为1.1.1.1
1, 在192.168.10.110:/var/www/mrtg/ 目录下面新建一个文件夹1.1.1.1
2, 将192.168.10.110:/var/www/mrtg/192.168.10.102/ 目录下面的配置文件192.168.10.102复制到文件夹1.1.1.1下面,改名为1.1.1.1
3, 打开1.1.1.1 在查看模式下 将IP地址192.168.10.102替换为1.1.1.1;命令为
:%s/192.168.10.102/1.1.1.1,保存退出;
4, 执行命令indexmaker --output=/var/www/mrtg/1.1.1.1/index.html /var/www/mrtg/1.1.1.1/1.1.1.1
5, env LANG=C /usr/bin/mrtg /var/www/mrtg/1.1.1.1/1.1.1.1 执行3次,没报错就OK
6, 将env LANG=C /usr/bin/mrtg /var/www/mrtg/1.1.1.1/1.1.1.1 这条命令添加到/var/www/mrtg/crond.sh 中让其每2分钟执行一次;
7, 在主页左侧上添加链接,打开 /var/www/mrtg/indextest.html 找到
<tr>
<td width=13><img src="http://192.168.10.110/mrtg/greendot.gif" width="13" height="14" name="tac-dot"></td>
<td nowrap width=134><a href="http://192.168.10.110/mrtg/192.168.10.102/index.html" target=another onMouseOver="switchdot('tac-dot',1)" onMouseOut="switchdot('tac-dot',0)" class="NavBarItem">192.168.10.102</a></td>
</tr> 复制以上4行,在该</tr>下面插入,复制的4行,修改192.168.10.110为1.1.1.1保存退出;
一般刷mrtg的问题:
1,需要注意的是,服务器端与客户端的snmp一定要开启,可以用snmpwalk -v 1 -c public IP 来检验,如果出来很多信息就OK了,如果只有少量信息,那就是不完整的,需要更新mib库,需要在snmpd.conf里面添加OID
2,cfg文件写的时候不能出错,不然执行 env LANG=C /usr/bin/mrtg /var/www/mrtg/192.168.10.102/192.168.10.102 就报错,可以根据提示内容,看错在什么地方,做相应的修改;
附上linux机器mrtg配置文件
首先做准备工作,保证可以抓到要监控的主机的数据:
再要抓取的linux主机上面设置修改/etc/default/snmpd文件
SNMPDOPTS='-Lsd -Lf /dev/null -u snmp -I -smux -p /var/run/snmpd.pid 127.0.0.1'去掉127.0.0.1,这就是允许所有的主机来抓取他自己的数据
修改/etc/snmp/snmpd.conf
将如下行前面的"#"去掉,并在其上一行前加“#”:
#com2sec readonly default public
将“view system”行修改为如下
view mib included .iso.org.dod.internet.mgmt.mib-2 fc
将如下行: access MyROSystem "" any noauth exact system none none
修改为: access MyROSystem "" any noauth exact mib2 none none
!!!如果还是不能抓取数据注意iptables防火墙的设置
下面是抓去linux主机的snmp信息的配置文件
Options[_]: growright, bits
WorkDir: /var/www/mrtg/192.168.10.223
LoadMIBs: /usr/share/snmp/mibs/UCD-SNMP-MIB.txt
EnableIPv6: no
#--eth0
Target[eth0]: 2:public@192.168.10.223:::::2
Xsize[eth0]: 360
#Unscaled[eth0]: ymw
#Suppress[eth0]: ymw
MaxBytes[eth0]: 125000000000
Title[eth0]: eth0 traffic @ 192.168.10.223
Options[eth0]: growright, nopercent, nolegend, nobanner, unknaszero, bits
PageTop[eth0]: <h1>eth0 traffic @ 192.168.10.223</h1>
YLegend[eth0]: traffic (b/s)
ShortLegend[eth0]: bits/s
LegendI[eth0]: In/s:
LegendO[eth0]: Out/s:
Legend1[eth0]: In/s
Legend2[eth0]: Out/s
#tcp
Target[tcpopen]: .1.3.6.1.2.1.6.9.0&.1.3.6.1.2.1.6.9.0:public@192.168.10.223
Xsize[tcpopen]: 360
#Unscaled[tcpopen]: ymw
#Suppress[tcpopen]: ymw
MaxBytes[tcpopen]: 65535
Title[tcpopen]: Tcpopen @ 192.168.10.223
Options[tcpopen]: growright, nopercent, nolegend, nobanner, unknaszero,gauge
PageTop[tcpopen]: <h1> Tcpopen@ 192.168.10.223</h1>
YLegend[tcpopen]: number
ShortLegend[tcpopen]: number
LegendI[tcpopen]: tcpopen;
LegendO[tcpopen]: tcpopen;
#Memory
Target[server.memoryUsed]: .1.3.6.1.4.1.2021.4.6.0&.1.3.6.1.4.1.2021.4.4.0:public@192.168.10.223 / .1.3.6.1.4.1.2021.4.5.0&.1.3.6.1.4.1.2021.4.3.0:public@192.168.10.223 * 100
Title[server.memoryUsed]: Memory Used
PageTop[server.memoryUsed]: <H1>内存可用率 192.168.10.223</H1>
MaxBytes[server.memoryUsed]: 204800000
ShortLegend[server.memoryUsed]: %
Xsize[server.memoryUsed]: 360
YLegend[server.memoryUsed]: Memory Available
Legend1[server.memoryUsed]: Vir in next minute
Legend2[server.memoryUsed]: Phy in next minute
Legend3[server.memoryUsed]: Maximal 5 Minute Vir
Legend4[server.memoryUsed]: Maximal 5 Minute Phy
LegendI[server.memoryUsed]: 物理内存可用率
LegendO[server.memoryUsed]: 虚拟内存可用率
Options[server.memoryUsed]: growright,nopercent,gauge
#disk
Target[disk]: .1.3.6.1.2.1.25.2.3.1.6.31&.1.3.6.1.2.1.25.2.3.1.6.31:public@192.168.10.223 / .1.3.6.1.2.1.25.2.3.1.5.31&.1.3.6.1.2.1.25.2.3.1.5.31:public@192.168.10.223 * 100
Xsize[disk]: 360
Options[disk]: gauge,growright
MaxBytes[disk]: 10000000000
YLegend[disk]: disk used
ShortLegend[disk]: %
Legend1[disk]: 硬盘使用率%
Legend2[disk]: 硬盘使用率%
LegendI[disk]: 硬盘使用率
LegendO[disk]: 硬盘使用率
Title[disk]: disk Used
PageTop[disk]: <H1>硬盘使用率 192.168.10.223</H1>
#load
Target[load]: .1.3.6.1.4.1.2021.10.1.3.1&.1.3.6.1.4.1.2021.10.1.3.2:public@192.168.10.223
Xsize[load]: 360
Options[load]: growright
MaxBytes[load]: 100000
YLegend[load]:load average
ShortLegend[load]: load
Legend1[load]: 1分钟load
Legend2[load]: 5分钟load
LegendI[load]: 1分钟load
LegendO[load]: 5分钟load
Title[load]: disk Used
PageTop[load]: <H1>load 192.168.10.223</H1>
下面是英文的配置文件:
# CPU
Target[CPU]: .1.3.6.1.4.1.311.1.1.3.1.1.2.1.3.1.48&.1.3.6.1.4.1.311.1.1.3.1.1.2.1.3.1.48:public@192.168.10.102
Xsize[CPU]: 360
MaxBytes[CPU]: 100
Title[CPU]: Windows2003 CPU...
PageTop[CPU]: <H1> CPU @ 192.168.10.102</H1>
ShortLegend[CPU]: %
YLegend[CPU]: CPU Load
Legend1[CPU]: CPU Utilization
Legend2[CPU]: .
Legend3[CPU]: Max Value Per-Interval
Legend4[CPU]: .
Options[CPU]: gauge, growright, nopercent, unknaszero
#memory
Target[server.memoryUsed]: .1.3.6.1.2.1.25.2.3.1.6.3&.1.3.6.1.2.1.25.2.3.1.6.4:public@192.168.10.102 / .1.3.6.1.2.1.25.2.3.1.5.3&.1.3.6.1.2.1.25.2.3.1.5.4:public@192.168.10.102 * 100
Title[server.memoryUsed]: Memory Used
PageTop[server.memoryUsed]: <H1>Memory 192.168.10.102</H1>
MaxBytes[server.memoryUsed]: 204800000
ShortLegend[server.memoryUsed]: %
Xsize[server.memoryUsed]: 360
YLegend[server.memoryUsed]: % Memory Used
Legend1[server.memoryUsed]: Vir in next minute
Legend2[server.memoryUsed]: Phy in next minute
Legend3[server.memoryUsed]: Maximal 5 Minute Vir
Legend4[server.memoryUsed]: Maximal 5 Minute Phy
LegendI[server.memoryUsed]: Vir
LegendO[server.memoryUsed]: Phy
Options[server.memoryUsed]: growright,nopercent,gauge
#tcp
Target[tcpopen]: .1.3.6.1.2.1.6.9.0&.1.3.6.1.2.1.6.9.0:public@192.168.10.102
Xsize[tcpopen]: 360
#Unscaled[tcpopen]: ymw
#Suppress[tcpopen]: ymw
MaxBytes[tcpopen]: 65535
Title[tcpopen]: Tcpopen @ 192.168.10.102
Options[tcpopen]: growright, nopercent, nolegend, nobanner, unknaszero,gauge
PageTop[tcpopen]: <h1> TCPì½ÓÊý @ 192.168.10.102</h1>
YLegend[tcpopen]: number
ShortLegend[tcpopen]: number
LegendI[tcpopen]: ×î´ó;
LegendO[tcpopen]: µ±Ç°;
#disk
Target[server.storageUsed]: .1.3.6.1.2.1.25.2.3.1.6.1&.1.3.6.1.2.1.25.2.3.1.6.2:public@192.168.10.102 / .1.3.6.1.2.1.25.2.3.1.5.1&.1.3.6.1.2.1.25.2.3.1.5.1:public@192.168.10.102 * 100
Xsize[server.storageUsed]: 360
Title[server.storageUsed]: Disk Used
PageTop[server.storageUsed]: <H1>Disk 192.168.10.102</H1>
MaxBytes[server.storageUsed]: 523444000
ShortLegend[server.storageUsed]: %
YLegend[server.storageUsed]: % Disk Used
Legend1[server.storageUsed]: C: in next minute
Legend2[server.storageUsed]: D: in next minute
Legend3[server.storageUsed]: Maximal 5 Minute C:
Legend4[server.storageUsed]: Maximal 5 Minute D:
LegendI[server.storageUsed]: C:
LegendO[server.storageUsed]: D:
Options[server.storageUsed]: growright,nopercent,gauge
使用snmpwalk -v 1 -c public 192.168.10.101 |grep ProcessorLoad
snmpwalk -v 1 -c public 192.168.10.101 .1.3.6.1.2.1.25.3.3.1.1
Snmptranslate –IR –On 后面跟字符串,把相应的字符串转化为OID
snmptranslate -IR -On hrProcessorLoad


