面向初学者的10行python代码,用于构建决策树并将其可视化

> Photo by Jessica Lewis on Unsplash
二十个问题是一款游戏,从本质上讲,您可以通过问20个"是/否"问题来猜测答案。 决策树是一种基于相同原理的算法。 它是一种机器学习方法,可让您根据一系列问题来确定所讨论对象属于哪个类别。
Prateek Karkare的一篇非常不错的文章阐述了该算法背后的直觉。 让我们看看如何编写代码。
数据集
我们将使用鸢尾花数据集。 该数据集列出了3种不同类型的鸢尾花的一些特征-萼片和花瓣的长度以及宽度。 我们要对决策树进行的操作是基于这些功能来区分这三种虹膜类型-Iris Setosa,Iris Versicolor和Iris Virginica。


> Versicolor | Virginica | Setosa
我们为每种虹膜类型提供的功能将有助于我们区分它们。 例如,从上面的图像中,我们可以清楚地看到Virginica的花瓣比Setosa的花瓣宽得多,并且快速浏览数据可以证实这一发现。


> source — integratedots
维基百科提到了数据集的完整细节。 可以去那里深入研究数据集。 我们需要开始编码的所有事情是,数据集中有150行,每种虹膜类型有50行。
· 0类代表Setosa,占用0–49行
· 第1类代表Versicolor,占用50–99行
· 第2类代表维珍妮卡,占据100–149行
现在,让我们开始构建构建决策树所需的代码。
代码演练
1)加载并查看数据
让我们将数据加载到内存中,查看功能并打印每种花卉的一些示例。
from sklearn.datasets import load_irisiris = load_iris()#Print Feature Namesprint("Feature Names - ", iris.feature_names,"")

> Wikipedia gives these features

> Features extracted by Python from the actual dataset
#Print the row 0,50 and 100 i.e. 1 example for each typeprint("Setosa flower 1 - ",iris.data[0])print("Versicolor flower 1 - ",iris.data[50])print("Virginica flower 1 - ",iris.data[100],"")

这与上面数据集部分中粘贴的Wikipedia屏幕快照匹配。
2)分割数据集
在任何机器学习算法中,我们都需要在与测试数据集非常不同的集合上训练模型。 因此,我们将数据集分为两部分。
import numpy as np#Choose top 2 examples of each flower type as test rowstest_indices = [0,1,50,51,100,101]#training datatrain_target = np.delete(iris.target, test_indices)train_data = np.delete(iris.data, test_indices, axis=0)#testing datatest_target = iris.target[test_indices]test_data = iris.data[test_indices]3)训练和测试决策树分类器
我们将使用Python的sklearn库来构建决策树分类器
from sklearn import tree#Build the classifierdtClassifier = tree.DecisionTreeClassifier()#Train the classifierdtClassifier.fit(train_data, train_target)#Print the actual labels of each test pointprint("********** Actual **************")for p in range(len(test_indices)): print("Test Row ",test_indices[p], " belongs to the class ",test_target[p] )predicted_target = (dtClassifier.predict(test_data))#Print the predicted labels of each test pointprint("********** Predicted **************")for p in range(len(test_indices)): print("Test Row ",test_indices[p], " is predicted to be of the class ", predicted_target[p] )

4)可视化树
我们将使用graphviz库将树可视化。 macOS用户将必须使用自制软件安装graphviz,而pip安装将无法进行。
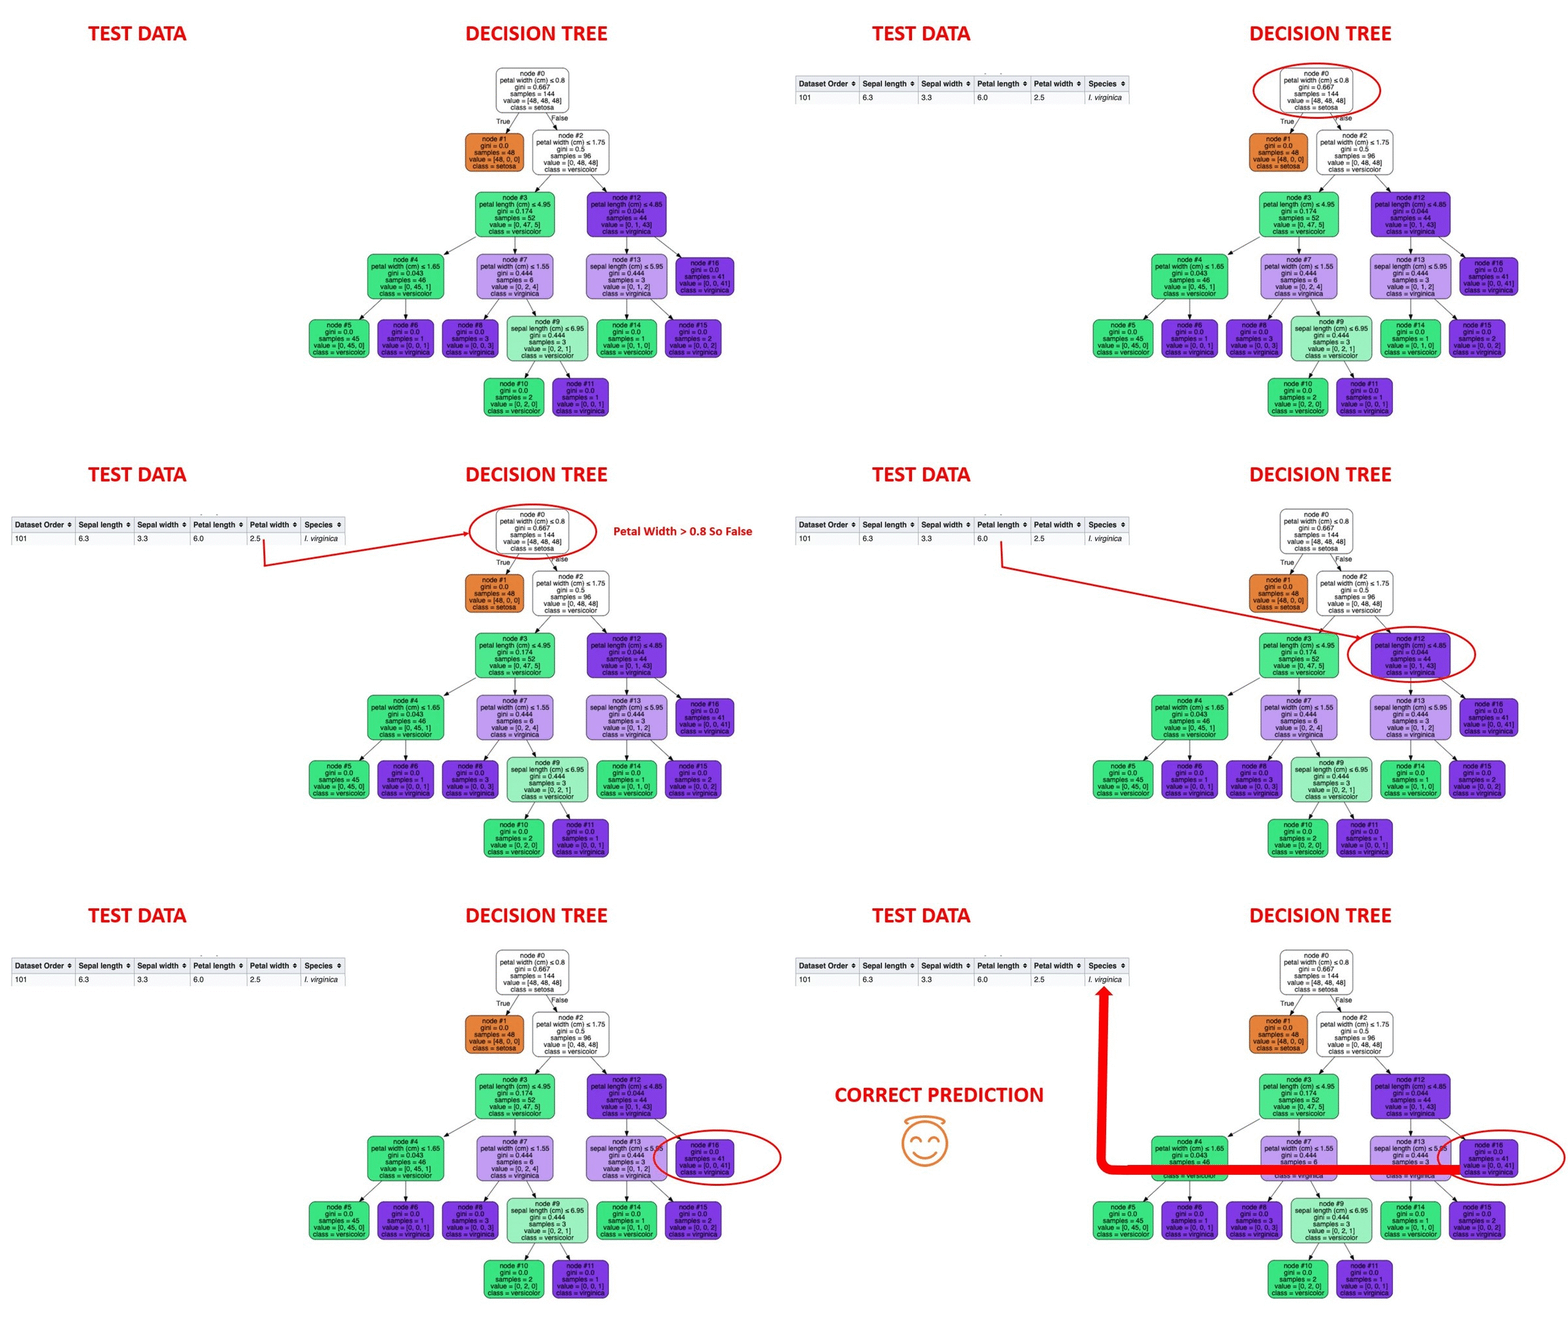
#Visualize The Decision Treefrom graphviz import Sourcegraph = Source(tree.export_graphviz(dtClassifier, out_file=None, feature_names=iris.feature_names, class_names=iris.target_names, filled=True, rounded=True, node_ids= True, special_characters=True))graph.format = 'png'graph.render('dtree_render',view=True)观察如何在树的每个节点上做出决定,然后根据答案向左或向右移动。 节点0检查花瓣宽度是否≤0.8 cm。 如果真是这样,那朵花马上就被定为濑户osa。 否则,我们转到节点2并检查花瓣宽度是否≤1.75cm,依此类推。

> Graphviz Output Image
查看通过决策树运行的实际测试行。 有问题的示例行是Virginica类的第100行。

您可以尝试在树中运行自己的示例,然后查看它是否适合您。
完整的代码要点在这里。
下一步
单个决策树本身并没有太大用处。 仅拥有一个决策树是很容易出错并且不可靠的。 相反,决策树更实际的用例是使用很多决策树。 那就是所谓的随机森林。 本文将对随机森林进行直观的了解。 将来,我们还将为随机森林构建类似的代码演练。
AI毕业生的目标是组织和建立AI社区,该社区不仅是开源的,而且关注其道德和政治方面。 随后将有更多此类实验驱动的简化AI概念出现。 如果您喜欢这个或有任何反馈或后续问题,请在下面评论。


