knitr::opts_chunk$set(echo = TRUE)
台大《机器学习基石》第二周课的笔记,只整理部分重要内容。希望能把课上学的,做一个精简的记录。
变量说明


更新理由

判断类别的公式:


所以迭代次数T<script type="math/tex" id="MathJax-Element-33">T</script>有上界。
案例
构造数据集
构造数据集,验证算法。
x11 <- 1:10
x21 <- x11 + runif(10, 0, 1) + 3
x22 <- x11 - runif(10, 0, 1)
example_data <- data.frame(x1 = rep(x11, 2),
x2 = c(x21, x22),
label = rep(c(1, -1), each = 10))
example_data$label <- as.factor(example_data$label)
library(ggplot2)
ggplot(data = example_data, aes(
x = x1,
y = x2,
color = label,
shape = label
)) +
geom_point()

PLA算法
## 参数:数据集、标签名称

PLA_f <- function(dataset, label) {
  ## 样本数
  row_num <-  nrow(dataset)
  w <- rep(1, ncol(dataset))
  w0 <- matrix(w, 1, 3, byrow = T)
  real_label <- as.numeric(as.vector(dataset[, label]))
  feature_matrix <-
    as.matrix(data.frame(x0 = rep(1, row_num), cbind(dataset[, setdiff(colnames(dataset), label)])))
  i <- 1
  j <- 0
  while (i < row_num & j == 0) {
    i <- 1
    j <- 0
    for (i in 1:row_num) {
      ## 判断是否有误判
      if (as.vector(feature_matrix[i,] %*% t(w0)) * real_label[i] <= 0) {
        ## 存在误判,修正w0
        w0 <- w0 + real_label[i] * feature_matrix[i,]
        w <- c(w, w0)
        j <- 1
      }
      if(j == 1){
        j <- 0
        i <- row_num-1
        break()}
    }
  }
  w_data <- data.frame(matrix(w,ncol=ncol(dataset),byrow = TRUE))
  colnames(w_data) <- paste0("x",0:(ncol(feature_matrix)-1))
  w_data <- dplyr::mutate(w_data,
                          slope = -x1 / x2,
                          intercept = -x0 / x2)
  return(w_data)
}
求解
w_data <- PLA_f(dataset = example_data, label = "label")
w_data
x0 x1           x2        slope    intercept
1   1  1  1.000000000   -1.0000000   -1.0000000
2   0  0  0.495471116    0.0000000    0.0000000
3  -1 -1 -0.009057768 -110.4024725 -110.4024725
4   0  0  4.912654036    0.0000000    0.0000000
5  -1 -1  4.408125152    0.2268538    0.2268538
6  -2 -2  3.903596268    0.5123481    0.5123481
7  -3 -4  1.915120282    2.0886417    1.5664812
8  -2 -1  8.363856425    0.1195621    0.2391241
9  -3 -2  7.859327541    0.2544747    0.3817120
10 -4 -4  5.870851555    0.6813322    0.6813322
11 -5 -9  1.747566727    5.1500179    2.8611211
12 -4 -8  6.669278532    1.1995300    0.5997650
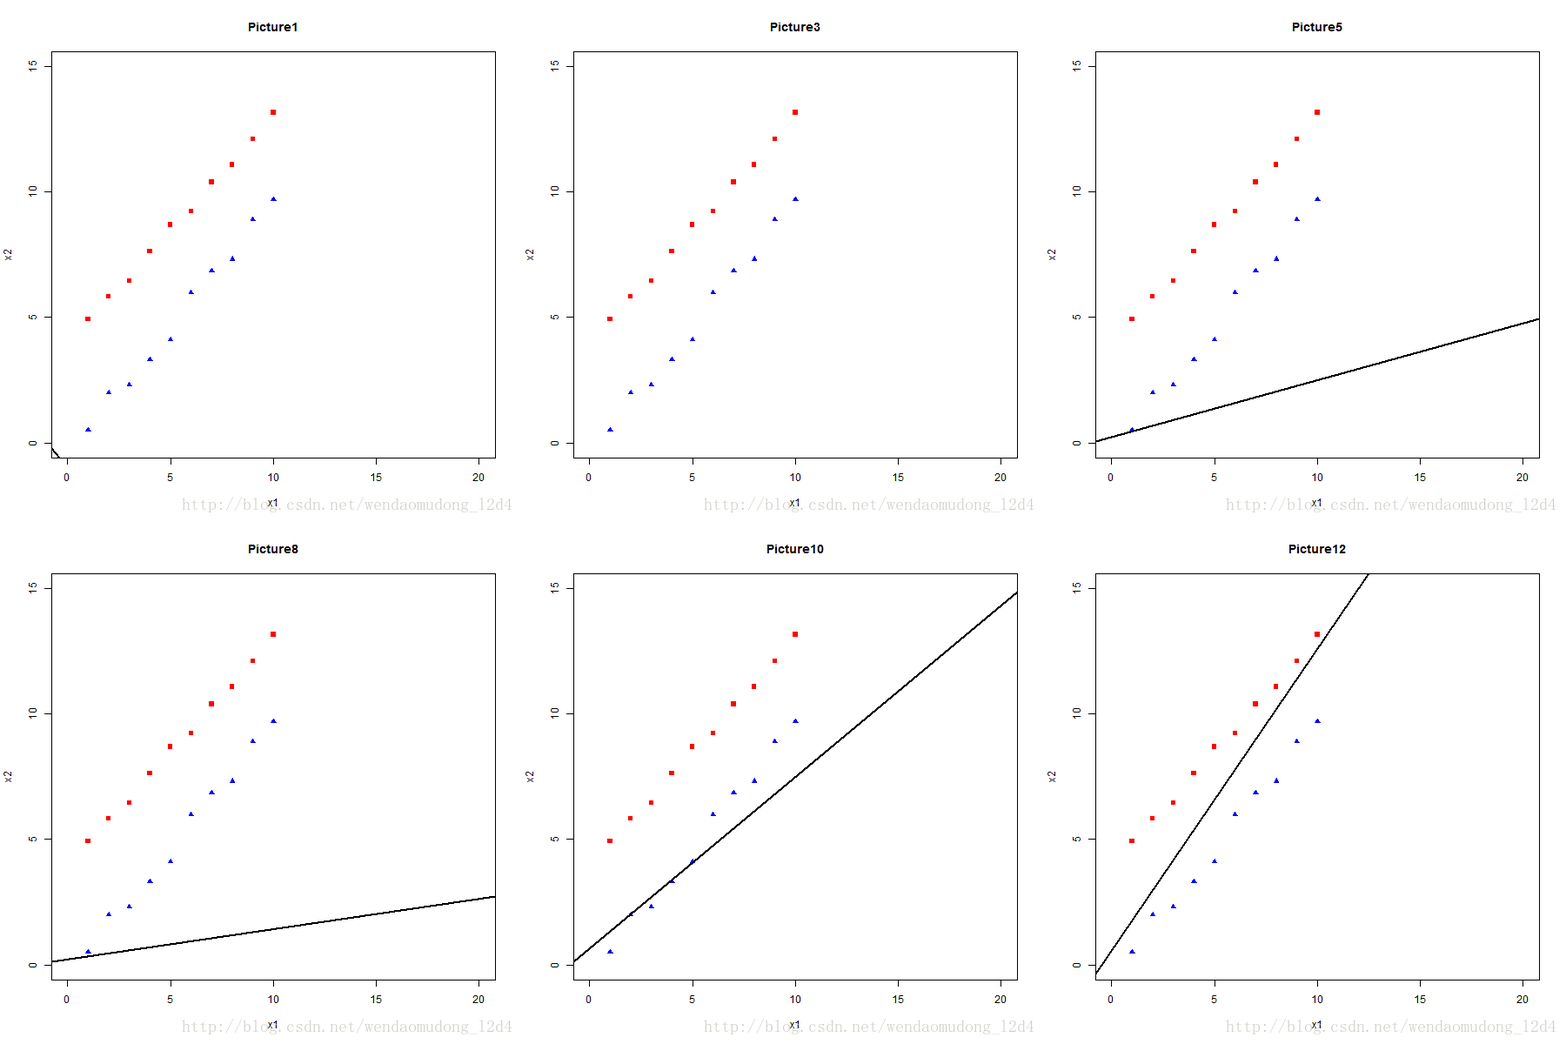
动图
library(animation)
## 指定ImageMagic目录位置,注意是magick.exe,之前版本貌似一致是convert.exe
ani.options(convert = "D:/ImageMagic/ImageMagick-7.0.7-Q16/magick.exe")
saveGIF(
  expr = {
    library(ggplot2)
    for (i in 1:nrow(w_data)) {plot(
      x = example_data$x1[1:10],
      y = example_data$x2[1:10],
      pch = 15,
      col = "red",
      xlim = c(0, 20),
      ylim = c(0, 15),
      xlab = "x1",
      ylab = "x2",main = paste0("Picture",i)
    )
      lines(x = example_data$x1[11:20],
            y = example_data$x2[11:20],
            type = "p",
            pch = 17,
            col = "blue")
      abline(coef=c(w_data$intercept[i],w_data$slope[i]),lwd=2)
      }
  },
  ## GIF文件名,注意文件后缀名要加上
  movie.name = "PLA.gif",
  ## 时间间隔
  interval = 1,
  ## 图形设置
  ani.width = 600,
  ani.height = 600,
  ## 文件输出在当前目录
  outdir = getwd()
)

Ref
[1]课程PPT
2017-12-19于杭州


