
学习python总会被一些炫酷的python库所惊讶,Python库已经成为Python语言的一大亮点,众多的Python库不仅为我们的学习提供乐趣,也提高了我们开发的效率。今天接着为大家介绍一个炫酷无比的Python库-animatplot,animatplot是一个基于Matplotlib的Python动图库,通过这个库可以画出花哨的动态图形。
效果预览
安装
animatplot库可以直接通过pip命令安装,其使用需要依赖matplotlib第三方库。安装命令:
pip install animatplot
功能模块
Animation:将Block和Timeline组合起来,创建图形
Animation(blocks[, timeline, fig])
2、Block:表示需要被画的数据块
Block([ax, t_axis])
Line(x, y[, ax, t_axis])
Quiver(X, Y, U, V[, ax, t_axis])
Pcolormesh(*args[, ax, t_axis])
Imshow(images[, ax, t_axis])
Nuke(func, length[, fargs, ax, axis])
3、Timeline:控制画图的时间逻辑模块
Timeline(t[, units, fps, log])
资源地址
项目链接:
https://github.com/t-makaro/animatplot
文档:
https://animatplot.readthedocs.io/en/latest
使用示例
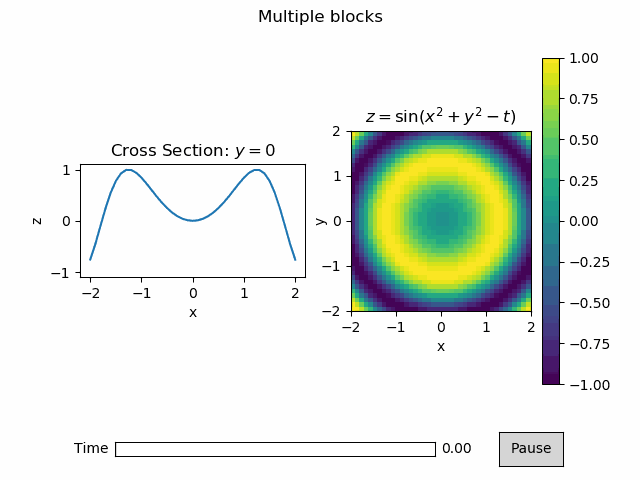
(由于动态图尺寸较大,无法上传,所以使用静态图并附上动态图地址)
一、Nuke
import numpy as np
import matplotlib.pyplot as plt
import animatplot as amp

#first construct our data
E0 = np.array([1, 2])
E0 = E0 / np.linalg.norm(E0)
phi = np.array([0, np.pi/7])
f = 3
t = np.linspace(0,2*np.pi,100)
ES = E0[:, np.newaxis]*np.exp(1j*(t+phi[:, np.newaxis]))

#animate the data
fig, ax = plt.subplots()

def animate(i):
    ax.set_title('Polarization')
    ax.set_aspect('equal')
    ax.set(xlim=(-1.2, 1.2), ylim=(-1.2, 1.2))

    E = E0*np.exp(1j*(f*t[i]+phi))

    xx = np.array([0,E[0].real,0])
    yy = np.array([0,0,0])
    uu = np.array([E[0].real,0,E[0].real])
    vv = np.array([0,E[1].real,E[1].real])

    plax = ax.plot(ES[0].real, ES.real[1])
    qax = ax.quiver(xx,yy,uu,vv,[0,55,200], scale_units='xy', scale=1.)

animate(0) # initialise the plot with the animate function

timeline = amp.Timeline(t, units='ns', fps=10)
block = amp.blocks.Nuke(animate, length=len(timeline), ax=ax)
anim = amp.Animation([block], timeline)

anim.controls()
anim.save_gif('nuke')
plt.show()
效果
动态图地址:
https://animatplot.readthedocs.io/en/latest/gallery/Nuke..html

二、Imshow
import numpy as np
import matplotlib.pyplot as plt
import animatplot as amp

#first construct our data
# Define LxL matrix
L = 55
# Initialize as random spin
M = 2*(np.random.rand(L,L)>.5)-1
J = 1
b = 2.5

nPer = 100

images = [M]
for i in range(100):
    M = M.copy()
    for dm in range(nPer):
        jj = int(np.random.rand()*L - 1)
        kk = int(np.random.rand()*L - 1)
        dE = 2*J*(M[jj+1,kk] + M[jj-1,kk] + M[jj,kk+1] + M[jj,kk-1])*M[jj,kk]
        if dE <= 0:
            M[jj,kk]*=-1
        else:
            if(np.random.rand()<np.exp(-b*dE)):
                M[jj,kk]*=-1
    images.append(M)
    M[:,-1] = M[:,0]
    M[-1,:] = M[0,:]

#animate the data
block = amp.blocks.Imshow(images)
anim = amp.Animation([block])

anim.controls()
anim.save_gif('ising')
plt.show()
效果
动态图地址:
https://animatplot.readthedocs.io/en/latest/gallery/imshow..html

三、Parametric
import numpy as np
import matplotlib.pyplot as plt
from matplotlib.animation import PillowWriter
import animatplot as aplt


def psi(t):
    x = t
    y = np.sin(t)
    return x, y


t = np.linspace(0, 2*np.pi, 25)
x, y = psi(t)
X, Y = aplt.util.parametric_line(x, y)

timeline = aplt.Timeline(t, 's', 24)

ax = plt.axes(xlim=[0, 7], ylim=[-1.1, 1.1])
block1 = aplt.blocks.Line(X, Y, ax)
# or equivalently
# block1 = aplt.blocks.ParametricLine(x, y, ax)

anim = aplt.Animation([block1], timeline)

# Your standard matplotlib stuff
plt.title('Parametric Line')
plt.xlabel('x')
plt.ylabel(r'y')

# Create Interactive Elements
anim.toggle()
anim.timeline_slider()

anim.save('parametric.gif', writer=PillowWriter(fps=5))
plt.show()
效果
动态图地址:
https://animatplot.readthedocs.io/en/latest/gallery/parametric..html

更多示例参看项目文档,对机器学习感兴趣的同学欢迎大家转发&转载本公众号文章,让更多学习机器学习的伙伴加入公众号《python练手项目实战》,在实战中成长。


