
- Video: Model Representation
- Reading: Model Representation
- Video: Cost Function
- Reading: Cost Function
- Video: Cost Function Intuition-1
- Reading: Cost Function Intuition-1
- Video: Cost Function Intuition-2
- Reading: Cost Function Intuition-1
2.1 Video: Model Representation
Our first learning algorithm will be linear regression.
In this video, you'll see what the model looks like and more importantly you'll see what the overall process of supervised learning looks like. Let's use some motivating example of predicting housing prices. We're going to use a data set of housing prices from the city of Portland, Oregon. And here I'm gonna plot my data set of a number of houses that were different sizes that were sold for a range of different prices. Let's say that given this data set, you have a friend that's trying to sell a house and let's see if friend's house is size of 1250 square feet and you want to tell them how much they might be able to sell the house for.

Well one thing you could do is fit a model. Maybe fit a straight line to this data. Looks something like that and based on that, maybe you could tell your friend that let's say maybe he can sell the house for around $220,000. So this is an example of a supervised learning algorithm. And it's supervised learning because we're given the, quotes, "right answer" for each of our examples. Namely we're told what was the actual house, what was the actual price of each of the houses in our data set were sold for and moreover, this is an example of a regression problem where the term regression refers to the fact that we are predicting a real-valued output namely the price. And just to remind you the other most common type of supervised learning problem is called the classification problem where we predict discrete-valued outputs such as if we are looking at cancer tumors and trying to decide if a tumor is malignant or benign. So that's a zero-one valued discrete output.

More formally, in supervised learning, we have a data set and this data set is called a training set. So for housing prices example, we have a training set of different housing prices and our job is to learn from this data how to predict prices of the houses. Let's define some notation that we're using throughout this course. We're going to define quite a lot of symbols. It's okay if you don't remember all the symbols right now but as the course progresses it will be useful to have a convenient notation . So I'm gonna use lower case m throughout this course to denote the number of training examples. So in this data set, if I have, you know, let's say 47 rows in this table. Then I have 47 training examples and m equals 47. Let me use lowercase x to denote the input variables often also called the features. That would be the x is here, it would the input features. And I'm gonna use y to denote my output variables or the target variable which I'm going to predict and so that's the second column here. Looking on notation, I'm going to use (x, y) to denote a single training example. So, a single row in this table corresponds to a single training example and to refer to a specific training example, I'm going to use this notation \(x^{(i)}\) comma gives me \(y^{(i)}\). And, we're going to use this to refer to the i'th training example. So this superscript i over here, this is not exponentiation right?
This \((x^{(i)},y^{(i)})\), the superscript i in parentheses that's just an index into my training set and refers to the i'th row in this table, okay? So this is not x to the power of i, y to the power of i. Instead \((x^{(i)},y^{(i)})\) just refers to the i'th row of this table. So for example, \(x^{(1)}\) refers to the input value for the first training example so that's 2104. That's this x in the first row. \(x^{(2)}\) will be equal to 1416 right? That's the second x, and \(y^{(1)}\) will be equal to 460. The first, the y value for my first training example, that's what that (1) refers to.
So as mentioned, occasionally I'll ask you a question to let you check your understanding and a few seconds in this video a multiple-choice question will pop up in the video. When it does, please use your mouse to select what you think is the right answer. What defined by the training set is. So here's how this supervised learning algorithm works. We saw that with the training set like our training set of housing prices and we feed that to our learning algorithm. Is the job of a learning algorithm to then output a function which by convention is usually denoted lowercase h and h stands for hypothesis. And what the job of the hypothesis is, is, is a function that takes as input the size of a house like maybe the size of the new house your friend's trying to sell so it takes in the value of x and it tries to output the estimated value of y for the corresponding house.

So h is a function that maps from x's to y's. People often ask me, you know, why is this function called hypothesis. Some of you may know the meaning of the term hypothesis, from the dictionary or from science or whatever. It turns out that in machine learning, this is a name that was used in the early days of machine learning and it kinda(kinda is an oral expression of "kind of") stuck. 'Cause maybe not a great name for this sort of function, for mapping from sizes of houses to the predictions, that you know.... I think the term hypothesis, maybe isn't the best possible name for this, but this is the standard terminology that people use in machine learning. So don't worry too much about why people call it that. When designing a learning algorithm, the next thing we need to decide is how do we represent this hypothesis h.
For this and the next few videos, I'm going to choose our initial choice , for representing the hypothesis, will be the following. We're going to represent h as follows. And we will write this as h subscript theta of x equals theta 0 plus theta 1 of x. And as a shorthand, sometimes instead of writing, you know, h subscript theta of x, sometimes there's a shorthand, I'll just write as a h of x. But more often I'll write it as a subscript theta over there. And plotting this in the pictures, all this means is that, we are going to predict that y is a linear function of x. Right, so that's the data set and what this function is doing, is predicting that y is some straight line function of x. That's h of x equals theta 0 plus theta 1 x, okay?
And why a linear function? Well, sometimes we'll want to fit more complicated, perhaps non-linear functions as well. But since this linear case is the simple building block, we will start with this example first of fitting linear functions, and we will build on this to eventually have more complex models, and more complex learning algorithms. Let me also give this particular model a name. This model is called linear regression or this, for example, is actually linear regression with one variable, with the variable being x. Predicting all the prices as functions of one variable X. And another name for this model is univariate linear regression. And univariate is just a fancy way of saying one variable. So, that's linear regression.
In the next video we'll start to talk about just how we go about implementing this model.
unfamiliar words
-
representation [ˌreprɪzenˈteɪʃn] n. 表现;描述;描绘; 代理人
the negative representation of single mothers in the media
媒体对单身母亲的负面描述
The green movement lacks effective representation in Parliament.
环境保护运动在议会中缺乏有力的支持者。
The new bill would remove student representation from the university Senate.
新议案将取消大学评议会中的学生代表。 -
overall [ˌoʊvərˈɔːl ] adj. 全面的;
exp: ADJ about the whole of something.
the person with overall responsibility for the project
全面负责本项目的人 -
quote [kwəʊt] v. 引用;报价 n. 引用, 引号
exp: V to repeat the exact words that another person has said or written
He quoted a passage from the minister's speech.
他引用了部长的一段讲话。
If you take text from other sources, place it in quotes .("")
引用其他来源的资料要放在引号里。 -
notation [nəʊˈteɪʃn] n. 符号;(数学、科学和音乐中的)记号;谱号
exp: N a system of signs or symbols used to represent information, especially in mathematics, science and music
Musical notation was conceived for the C major scale and each line and space represents a note in this scale.
五线谱以C大音阶构成,每一个线和间代表这个音阶的音符。 -
Namely [ˈneɪmli] 也就是說;
-
convenient [kənˈviːniənt] adj. 实用的;便利的;
exp: useful, easy or quick to do; not causing problems
Fruit is a convenient source of vitamins and energy.
水果是维生素和能量的便利来源。 -
correspond [ˌkɒrəˈspɒnd] vi. 相一致;符合;
exp: V to be the same as or match sth
Your account of events does not correspond with hers.
你对事情的陈述与她说的不相符。 -
corresponding [ˌkɒrəˈspɒndɪŋ] adj. 符合的;相应的; correspond的现在分词
Give each picture a number corresponding to its position on the page.
按所在页面位置给每一幅画编上相对应的号码。 -
exponentiation [ˌekspəʊˌnenʃɪ'eɪʃən] n. 取幂,求幂,乘方
-
hypothesis [haɪˈpɒθəsɪs] n.假设;
exp: N an idea or explanation of sth that is based on a few known facts but that has not yet been proved to be true or correct
to formulate/confirm a hypothesis
提出 / 证实假设 -
represent [ˌreprɪˈzent] vt.代表;作为…的代言人; 表示
2.2 Reading: Model Representation
To establish notation for future use, we’ll use \(x^{(i)}\) to denote the “input” variables (living area in this example), also called input features, and \(y^{(i)}\) to denote the “output” or target variable that we are trying to predict (price). A pair \((x^{(i)} , y^{(i)} )\) is called a training example, and the dataset that we’ll be using to learn—a list of m training examples \({(x^{(i)} , y^{(i)} ); i = 1, . . . , m}\)—is called a training set. Note that the superscript “(i)” in the notation is simply an index into the training set, and has nothing to do with exponentiation. We will also use X to denote the space of input values, and Y to denote the space of output values. In this example, X = Y = ℝ.
To describe the supervised learning problem slightly more formally, our goal is, given a training set, to learn a function h : X → Y so that h(x) is a “good” predictor for the corresponding value of y. For historical reasons, this function h is called a hypothesis. Seen pictorially, the process is therefore like this:

When the target variable that we’re trying to predict is continuous, such as in our housing example, we call the learning problem a regression problem. When y can take on only a small number of discrete values (such as if, given the living area, we wanted to predict if a dwelling is a house or an apartment, say), we call it a classification problem.
unfamiliar words
-
pictorial [pɪkˈtɔːriəl] n.画报;画刊;画页;图画邮票 adj. 用图片的;
Pictorial databases will become central components of many future applications.
图像库在许多未来的应用中将会作为一个重要的部分。 -
pictorially adj. 形象地
-
dwell [dwel] vi.居住;栖身
For ten years she dwelled among the nomads of North America.
她在北美游牧民中生活了十年。 -
dwelling [ˈdwelɪŋ] n.住处;住宅;
Some 3,500 new dwellings are planned for the area...
该地区计划筹建约 3,500 所新居。
2.3 Video: Cost Function
In this video we'll define something called the cost function, this will let us figure out how to fit the best possible straight line to our data.
In linear progression, we have a training set that I showed here remember on notation M was the number of training examples, so maybe m equals 47. And the form of our hypothesis, which we use to make predictions is this linear function.
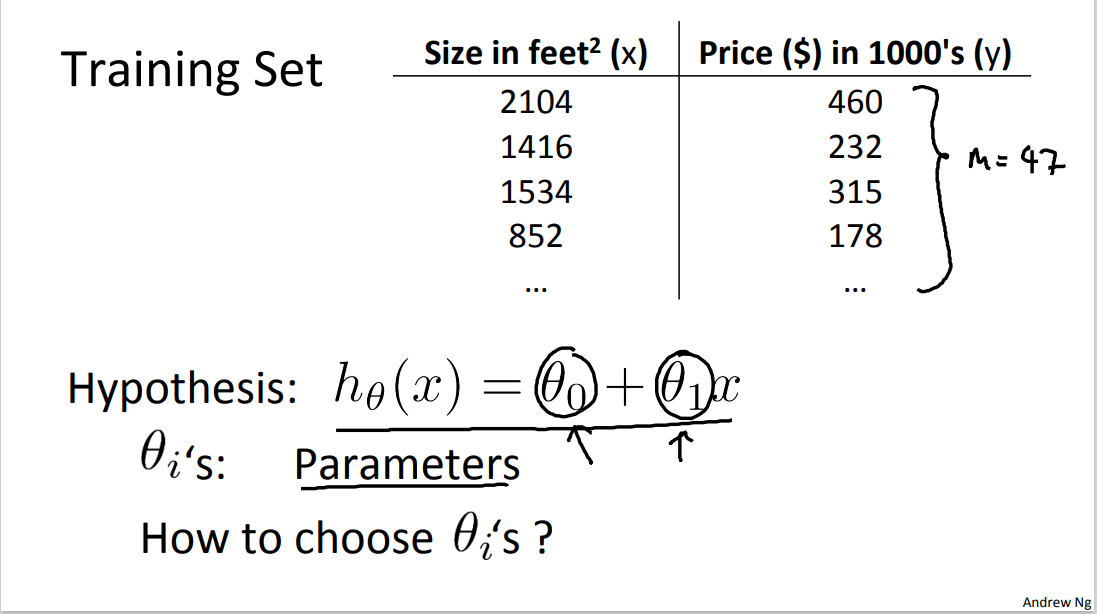
To introduce a little bit more terminology, these theta zero and theta one, they stabilize what I call the parameters of the model. And what we're going to do in this video is talk about how to go about choosing these two parameter values, theta 0 and theta 1. With different choices of the parameter's theta 0 and theta 1, we get different hypothesis, different hypothesis functions. I know some of you will probably be already familiar with what I am going to do on the slide, but just for review, here are a few examples.

If theta 0 is 1.5 and theta 1 is 0, then the hypothesis function will look like this. Because your hypothesis function will be h of x equals 1.5 plus 0 times x which is this constant value function which is flat at 1.5 . If theta_0 = 0, theta_1 = 0.5, then the hypothesis will look like this, and it should pass through this point 2,1 so that you now have h(x). Or really h of theta(x), but sometimes I'll just omit theta for brevity. So h(x) will be equal to just 0.5(zero point five) times x, which looks like that. And finally, if theta zero equals one, and theta one equals 0.5, then we end up with a hypothesis that looks like this. Let's see, it should pass through the two-two point. Like so, and this is my new vector of x, or my new h subscript theta of x. Whatever way you remember, I said that this is h subscript theta of x, but that's a shorthand, sometimes I'll just write this as h of x.
In linear regression, we have a training set, like maybe the one I've plotted here. What we want to do, is come up with values for the parameters theta zero and theta one so that the straight line we get out of this, corresponds to a straight line that somehow fits the data well, like maybe that line over there.
So, how do we come up with values, theta zero, theta one, that corresponds to a good fit to the data?
The idea is we get to choose our parameters theta 0, theta 1 so that h of x, meaning the value we predict on input x, that this is at least close to the values y for the examples in our training set, for our training examples. So in our training set, we've given a number of examples where we know X decides the wholes and we know the actual price is was sold for. So, let's try to choose values for the parameters so that, at least in the training set, given the X in the training set we make reason of the active predictions for the Y values.

Let's formalize this. So linear regression, what we're going to do is, I'm going to want to solve a minimization problem. So I'll write minimize over theta_0 theta_1. And I want this to be small, right? I want the difference between h(x) and y to be small. And one thing I might do is try to minimize the square difference between the output of the hypothesis and the actual price of a house. Okay. So lets find some details. You remember that I was using the notation \((x^{(i)},y^{(i)})\) to represent the i'th training example. So what I want really is to sum over my training set, something i = 1 to m, of the square difference between, this is the prediction of my hypothesis when it is input to size of house number i.
Right? Minus the actual price that house number I was sold for, and I want to minimize the sum of my training set, sum from I equals one through M, of the difference of this squared error, the square difference between the predicted price of a house, and the price that it was actually sold for. And just remind you of notation, m here was the size of my training set right? So my m there is my number of training examples. Right that hash sign is the abbreviation for number of training examples, okay? And to make some of our, make the math a little bit easier, I'm going to actually look at we are 1 over m times that so let's try to minimize my average minimize one over 2m. Putting the 2 at the constant one half in front, it may just sound the math probably easier so minimizing one-half of something, right, should give you the same values of the process, theta 0 theta 1, as minimizing that function.
And just to be sure, this equation is clear, right? This expression in here, h subscript theta(x), this is our usual, right?
That is equal to this plus theta one xi (xi is an oral expression of \(x^{(i)}\)). And this notation, minimize over theta 0 theta 1, this means you'll find me the values of theta 0 and theta 1 that causes this expression to be minimized and this expression depends on theta 0 and theta 1, okay? So just a recap. We're closing this problem as, find me the values of theta zero and theta one so that the average, the 1 over the 2m, times the sum of square errors between my predictions on the training set minus the actual values of the houses on the training set is minimized. So this is going to be my overall objective function for linear regression.
And just to rewrite this out a little bit more cleanly, what I'm going to do is, by convention we usually define a cost function, which is going to be exactly this, that formula I have up here. And what I want to do is minimize over theta0 and theta1. My function j(theta0, theta1). Just write this out. This is my cost function. So, this cost function is also called the squared error function.
When sometimes called the squared error cost function and it turns out that why do we take the squares of the erros. It turns out that these squared error cost function is a reasonable choice and works well for problems for most regression programs. There are other cost functions that will work pretty well. But the square cost function is probably the most commonly used one for regression problems. Later in this class we'll talk about alternative cost functions as well, but this choice that we just had should be a pretty reasonable thing to try for most linear regression problems. Okay. So that's the cost function.
So far we've just seen a mathematical definition of this cost function. In case this function j of theta zero, theta one. In case this function seems a little bit abstract, and you still don't have a good sense of what it's doing, in the next video, in the next couple videos, I'm actually going to go a little bit deeper into what the cause function "J" is doing and try to give you better intuition about what is computing and why we want to use it...
unfamiliar words
-
stabilize [ˈsteɪbəlaɪz] v. 稳定;(使)稳固
exp: V to become or to make sth become firm, steady and unlikely to change; to make sth stable
The patient's condition stabilized.
患者的病情稳定下来。
government measures to stabilize prices
政府稳定物价的措施 -
omit [əˈmɪt] v. 省略;忽略;
If you are a student, you can omit questions 16–18.
学生可以免做16–18题。 -
brevity [ˈbrevəti] n. 简洁;简炼;短暂
exp: N the quality of using few words when speaking or writing
The report is a masterpiece of brevity.
那份报告是言简意赅的典范。 -
objective [əbˈdʒektɪv] adj. 客观的;就事论事的;
exp: ADJ not influenced by personal feelings or opinions; considering only facts
an objective analysis/assessment/report
客观的分析 / 评价 / 报告
2.4 Reading: Cost Function
We can measure the accuracy of our hypothesis function by using a cost function. This takes an average difference (actually a fancier version of an average) of all the results of the hypothesis with inputs from x's and the actual output y's.
To break it apart, it is \(\frac{1}{2}\bar{x}\) where \(\bar{x}\) is the mean of the squares of \(h_{\theta}(x_{i})- y_{i}\) or the difference between the predicted value and the actual value.
This function is otherwise called the "Squared error function", or "Mean squared error". The mean is halved \(\left(\frac{1}{2}\right)\) as a convenience for the computation of the gradient descent, as the derivative term of the square function will cancel out the \(\frac{1}{2}\) term. The following image summarizes what the cost function does:
unfamiliar words
-
fancy [ˈfænsi] adj.异常复杂的;太花哨的, 高档的
exp: ADJ unusually complicated, often in an unnecessary way; intended to impress other people
a kitchen full of fancy gadgets
有各式各样小装置的厨房 -
fancier [ˈfænsiə(r)] n. 爱好者;(尤指)饲养迷,园艺迷adj.异常复杂的;
比较级 -
derivative [dɪ'rɪvətɪv] n.衍生物;派生物; 导数 dj.模仿他人的;
-
What I showed you at the beginning, and then erased, basically justifies how to take the derivative of a reciprocal function.
最开始我讲过了,如何对倒数函数求导。 -
exp: N a word or thing that has been developed or produced from another word or thing
The equity floor was a financial juggernaut and the derivative desk was at the center of it all.
股票交易场地是金融海洋的漩涡,而衍生品交易席位则是漩涡的最中心。
-


