
五、单序列XML形式
举例:
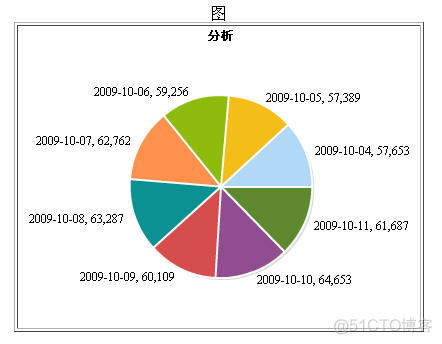
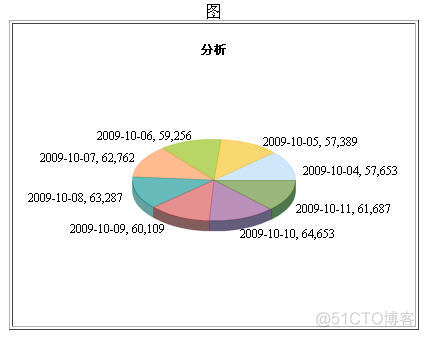
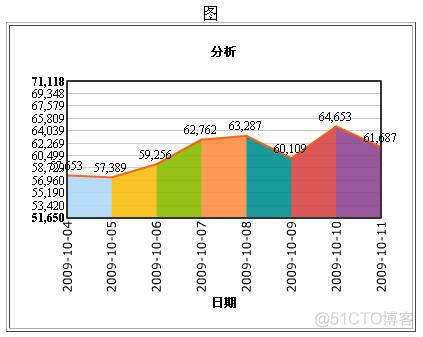
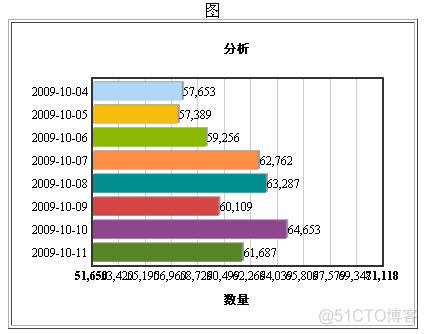
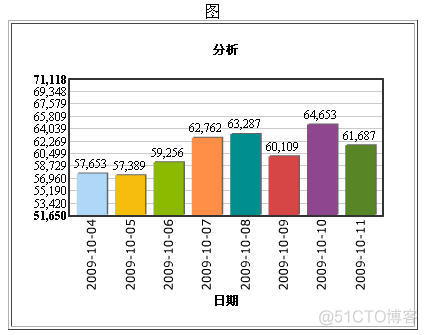
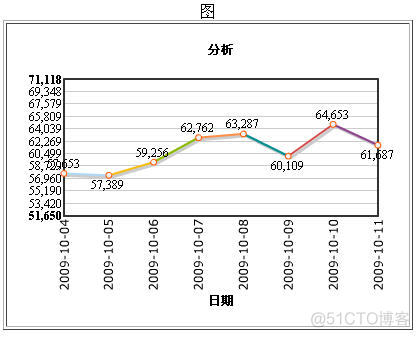
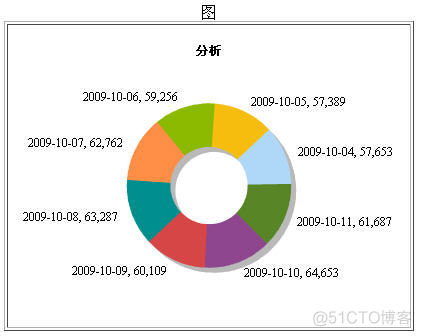
<graph baseFont='SunSim' baseFontSize='12' caption='分析' subcaption='' yAxisMinValue='51650.1' yAxisMaxValue='71118.3' xaxisname='日期' yaxisname='数量' hovercapbg='FFECAA' hovercapborder='F47E00' formatNumberScale='0' decimalPrecision='0' showvalues='1' numdivlines='10' numVdivlines='0' shownames='1' rotateNames='1'>
  <set name='2009-10-04' value='57653' color='AFD8F8'/>
  <set name='2009-10-05' value='57389' color='F6BD0F'/>
  <set name='2009-10-06' value='59256' color='8BBA00'/>
  <set name='2009-10-07' value='62762' color='FF8E46'/>
  <set name='2009-10-08' value='63287' color='008E8E'/>
  <set name='2009-10-09' value='60109' color='D64646'/>
  <set name='2009-10-10' value='64653' color='8E468E'/>
  <set name='2009-10-11' value='61687' color='588526'/>
</graph>
<graph>标签的一些属性:
baseFont: 图表的字体
baseFontSize: 图表的字号
caption: 标题
subcaption: 子标题
yAxisMinValue: y轴的最小值
yAxisMaxValue: y轴的最大值
hovercapbg: 当鼠标悬停时显示的背景色
hovercapborder: 当鼠标悬停时边框色
formatNumber(0/1):是否用逗号分隔(1--用逗号分隔,0--不用)
formatNumberScale(0/1): 是否添加K、M到数字(1--添加,0--不添加)
decimalPrecision: 小数的位数
showValues(0/1): 是否显示数值
numdivlines: 水平网格线的条数
numVdivlines: 垂直网络线显示的条数
showNames(0/1): 是否显示x轴的每个数据的名称
rotateNames(0/1): 是否旋转x轴的每个数据的名称
rotateYAxisName(0/1):是否显示y轴的名称
showAlternateHGridColor(0/1): 是否显示交替的网格颜色
<set>标签:
name: x轴的每个数据的名称
value: 值
有几种图可以使用单序列的XML格式的数据
(1)Pie图
FCF_Pie2D.swf FCF_Pie3D.swf
(2)Area图
FCF_Area2D.swf
(3)Bar图
FCF_Bar2D.swf
(4)Column图
FCF_Column2D.swf FCF_Column3D.swf

(5)Line图
FCF_Line.swf
(6)Doughnut图
FCF_Doughnut2D.swf
六、多序列XML形式
举例:
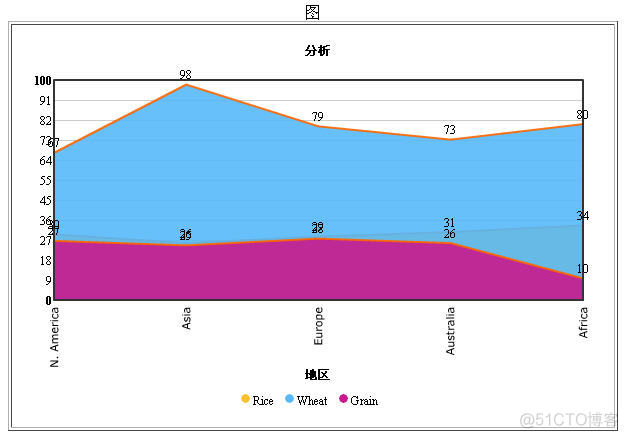
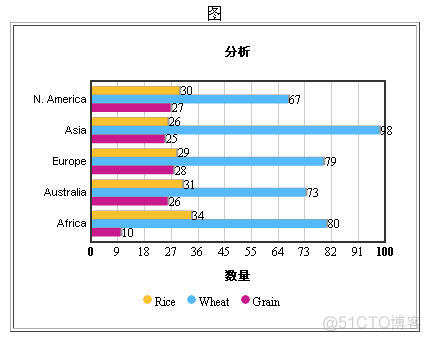
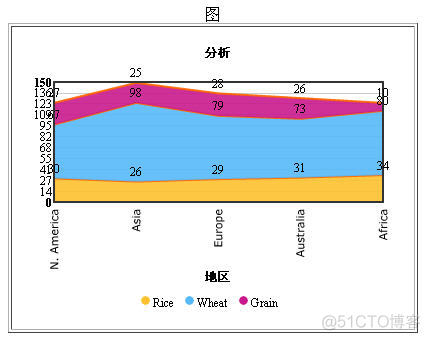
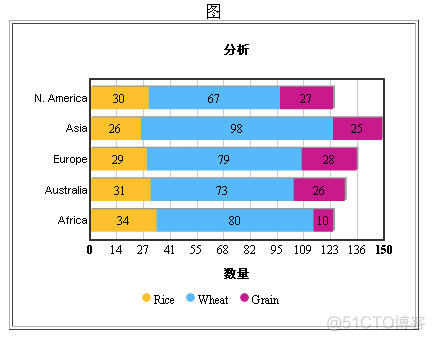
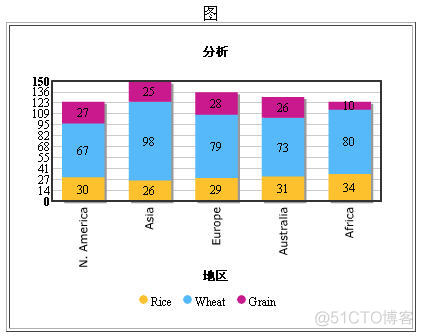
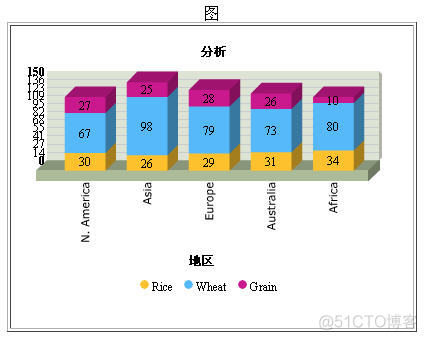
<graph baseFont='SunSim' baseFontSize='12' caption='分析' subcaption='' yAxisMinValue='0' yAxisMaxValue='100' xaxisname='地区
' yaxisname='数量' hovercapbg='FFECAA' hovercapborder='F47E00' formatNumberScale='0' decimalPrecision='0' showvalues='1'
numdivlines='10' numVdivlines='0' shownames='1' rotateNames='1' >
   <categories font='Arial' fontSize='11' fontColor='000000'>
      <category name='N. America' hoverText='North America'/>
      <category name='Asia' />
      <category name='Europe' />
      <category name='Australia' />
      <category name='Africa' />
   </categories>
   <dataset seriesname='Rice' color='FDC12E' alpha='100'>
      <set value='30' />
      <set value='26' />
      <set value='29' />
      <set value='31' />
      <set value='34' />
   </dataset>
    <dataset seriesname='Wheat' color='56B9F9' showValues='1' alpha='100'>
      <set value='67' />
      <set value='98' />
      <set value='79' />
      <set value='73' />
      <set value='80' />
   </dataset>
    <dataset seriesname='Grain' color='C9198D' showValues='1' alpha='100'>
      <set value='27' />
      <set value='25' />
      <set value='28' />
      <set value='26' />
      <set value='10' />
   </dataset>
</graph>
<graph>基本上同单序列XML形式
<categroies>指明x轴有几个种类
<categroy>对应一个种类
name:种类名
<dataset>指明一个序列集,序列集中值的个数同category的种类数
seriesname:序列的名称
<set>:序列的一个值
有几种图可以使用多序列的XML格式的数据
(1)Area图
FCF_MSArea2D.swf
(2)Bar图
FCF_MSBar2D.swf
(3)Column图
FCF_MSColumn2D.swf FCF_MSColumn3D.swf


(4)Line图
FCF_MSLine.swf

(5)Stacked图
FCF_StackedArea2D.swf
FCF_StackedBar2D.swf
FCF_StackedColumn2D.swf FCF_StackedColumn3D.swf
七、产生上述XML的类
public class FusionChartsXMLGenerator {

	public static final int BOOLEAN_TRUE = 0;
	public static final int BOOLEAN_FALSE = 1;
	private static Logger LOGGER = LoggerFactory.getLogger(FusionChartsXMLGenerator.class);

	private static FusionChartsXMLGenerator singleton = new FusionChartsXMLGenerator();

	public static FusionChartsXMLGenerator getInstance() {
		return singleton;
	}

	private FusionChartsXMLGenerator() {}

	private String[] colors = {"AFD8F8", "F6BD0F", "8BBA00", "FF8E46", "008E8E",
			"D64646", "8E468E", "588526", "B3AA00", "008ED6", "9D080D", "A186BE"};

	/**
	 * data形式为:
	 * "" category1,category2,category3...-------->这是第一行
	 * type1 value1,value2,value3,...
	 * type2 value1,value2,value3,...
	 * ......
	 */
	public String getMultiDSXML(List<List<String>> data,
			String caption, String subCaption,
			String xAxisName, String yAxisName,
			int showNames,int showValues,
			int decimalPrecision, int rotateNames) {
		double max = -Double.MAX_VALUE, min = Double.MAX_VALUE;
		for (int i = 1; i < data.size(); i++) {
			List row = (List)data.get(i);
			for (int j = 1; j < row.size(); j++) {
				String val = (String)row.get(j);
				if (val != null && val.length() > 0) {
					double v = Double.parseDouble(val);
					if (v > max) {
						max = v;
					}
					if (v < min) {
						min = v;
					}
				}
			}
		}

		if (max == -Double.MAX_VALUE) {
			max = 0;
		}

		if (min == Double.MAX_VALUE) {
			min = 0;
		}

		if (min == max && min == 0) {
			min = 0;
			max = 100;
		}


		max = Math.abs(max / 10) + max;
		min = min - Math.abs(min / 10);

		int valCnt = ((List)data.get(0)).size() - 1;
		if (valCnt > 30) {
			showNames = 0;
			showValues = 0;
		}

		StringBuffer strXml = new StringBuffer();
		strXml.append("<graph baseFont='SunSim' baseFontSize='12' caption='" +
				caption +"' subcaption='" + subCaption + "' " +
				"yAxisMinValue='" + min + "' yAxisMaxValue='" + max + "' " +
				"xAxisName='" + xAxisName + "' yAxisName='" + yAxisName + "' hovercapbg='FFECAA' " +
				"hovercapborder='F47E00' formatNumberScale='0' decimalPrecision='" + decimalPrecision + "' " +
				"showValues='" + showValues + "' numdivlines='10' numVdivlines='0' " +
				"showNames='" + showNames + "' rotateNames='" + rotateNames + "' " +
				"rotateYAxisName='0' showAlternateHGridColor='1'>");

		strXml.append("<categories>");
		List headerRow = (List)data.get(0);
		for (int i = 1; i < headerRow.size(); i++) {
			strXml.append("<category name='" + headerRow.get(i) + "'/>");
		}
		strXml.append("</categories>");

		for (int i = 1; i < data.size(); i++) {
			List row = (List)data.get(i);
			String name = (String)row.get(0);
			String color = colors[(i - 1) % 12];
			strXml.append("<dataset seriesName='" + name +"' " +
					"color='" + color + "' anchorBorderColor='" + color + "' " +
					"anchorBgColor='" + color + "'>");
			for (int j = 1; j < row.size(); j++) {
				strXml.append("<set value='" + (String)row.get(j) +"'/>");
			}
			strXml.append("</dataset>");
		}

		strXml.append("</graph>");
		String str =  strXml.toString();
		LOGGER.info("=============/n" + str + "/n==============/n");
		return str;
	}

	/**
	 *  数据格式为:
	 *  name value
	 *  name value
	 *  ......
	 */
	public String getSingleDSXML(List<List<String>> data,
			String caption, String subCaption,
			String xAxisName, String yAxisName,
			int showNames,int showValues,
			int decimalPrecision, int rotateNames) {

		double max = -Double.MAX_VALUE, min = Double.MAX_VALUE;
		for (int i = 0; i < data.size(); i++) {
			List<String> row = data.get(i);
			double value = Double.parseDouble(row.get(1));
			if (value > max) {
				max = value;
			}
			if (value < min) {
				min = value;
			}
		}

		if (max == -Double.MAX_VALUE) {
			max = 0;
		}

		if (min == Double.MAX_VALUE) {
			min = 0;
		}

		if (min == max && min == 0) {
			min = 0;
			max = 100;
		}


		max = Math.abs(max / 10) + max;
		min = min - Math.abs(min / 10);

		int valCnt = data.size() - 1;
		if (valCnt > 30) {
			showNames = 0;
			showValues = 0;
		}

		StringBuffer strXml = new StringBuffer();
		strXml.append("<graph baseFont='SunSim' baseFontSize='12' caption='" +
				caption +"' subcaption='" + subCaption + "' " +
				"yAxisMinValue='" + min + "' yAxisMaxValue='" + max + "' " +
				"xAxisName='" + xAxisName + "' yAxisName='" + yAxisName + "' hovercapbg='FFECAA' " +
				"hovercapborder='F47E00' formatNumberScale='0' decimalPrecision='" + decimalPrecision + "' " +
				"showValues='" + showValues + "' numdivlines='10' numVdivlines='0' " +
				"showNames='" + showNames + "' rotateNames='" + rotateNames + "' " +
				"rotateYAxisName='0' showAlternateHGridColor='1'>");
		for (int i = 0; i < data.size(); i++) {
			List<String> row = data.get(i);
			String label = row.get(0);
			String value = row.get(1);
			String color = colors[i % 12];
			strXml.append("<set name='" + label + "' value='" + value + "' color='" + color + "'/>");

		}
		strXml.append("</graph>");
		String str =  strXml.toString();
		LOGGER.info("=============/n" + str + "/n==============/n");
		return str;
	}
}


