一、开场白
先说一句,中国队NB!
这次“不务正业”的主题是瀑布图,这也算是我很早以前就想完成的东西了,即便如此,这次的完成度也并不算高,就是做个demo给自己乐呵乐呵,以后有机会用了再捡起来优化吧。这次用的是两种方式:一种是MFC+SignalLab,一种是Ipp+QCustomPlot。两种方式我想主要记录第二种,因为第一种确实没啥好记录的,而且还有个问题现在没有想清。
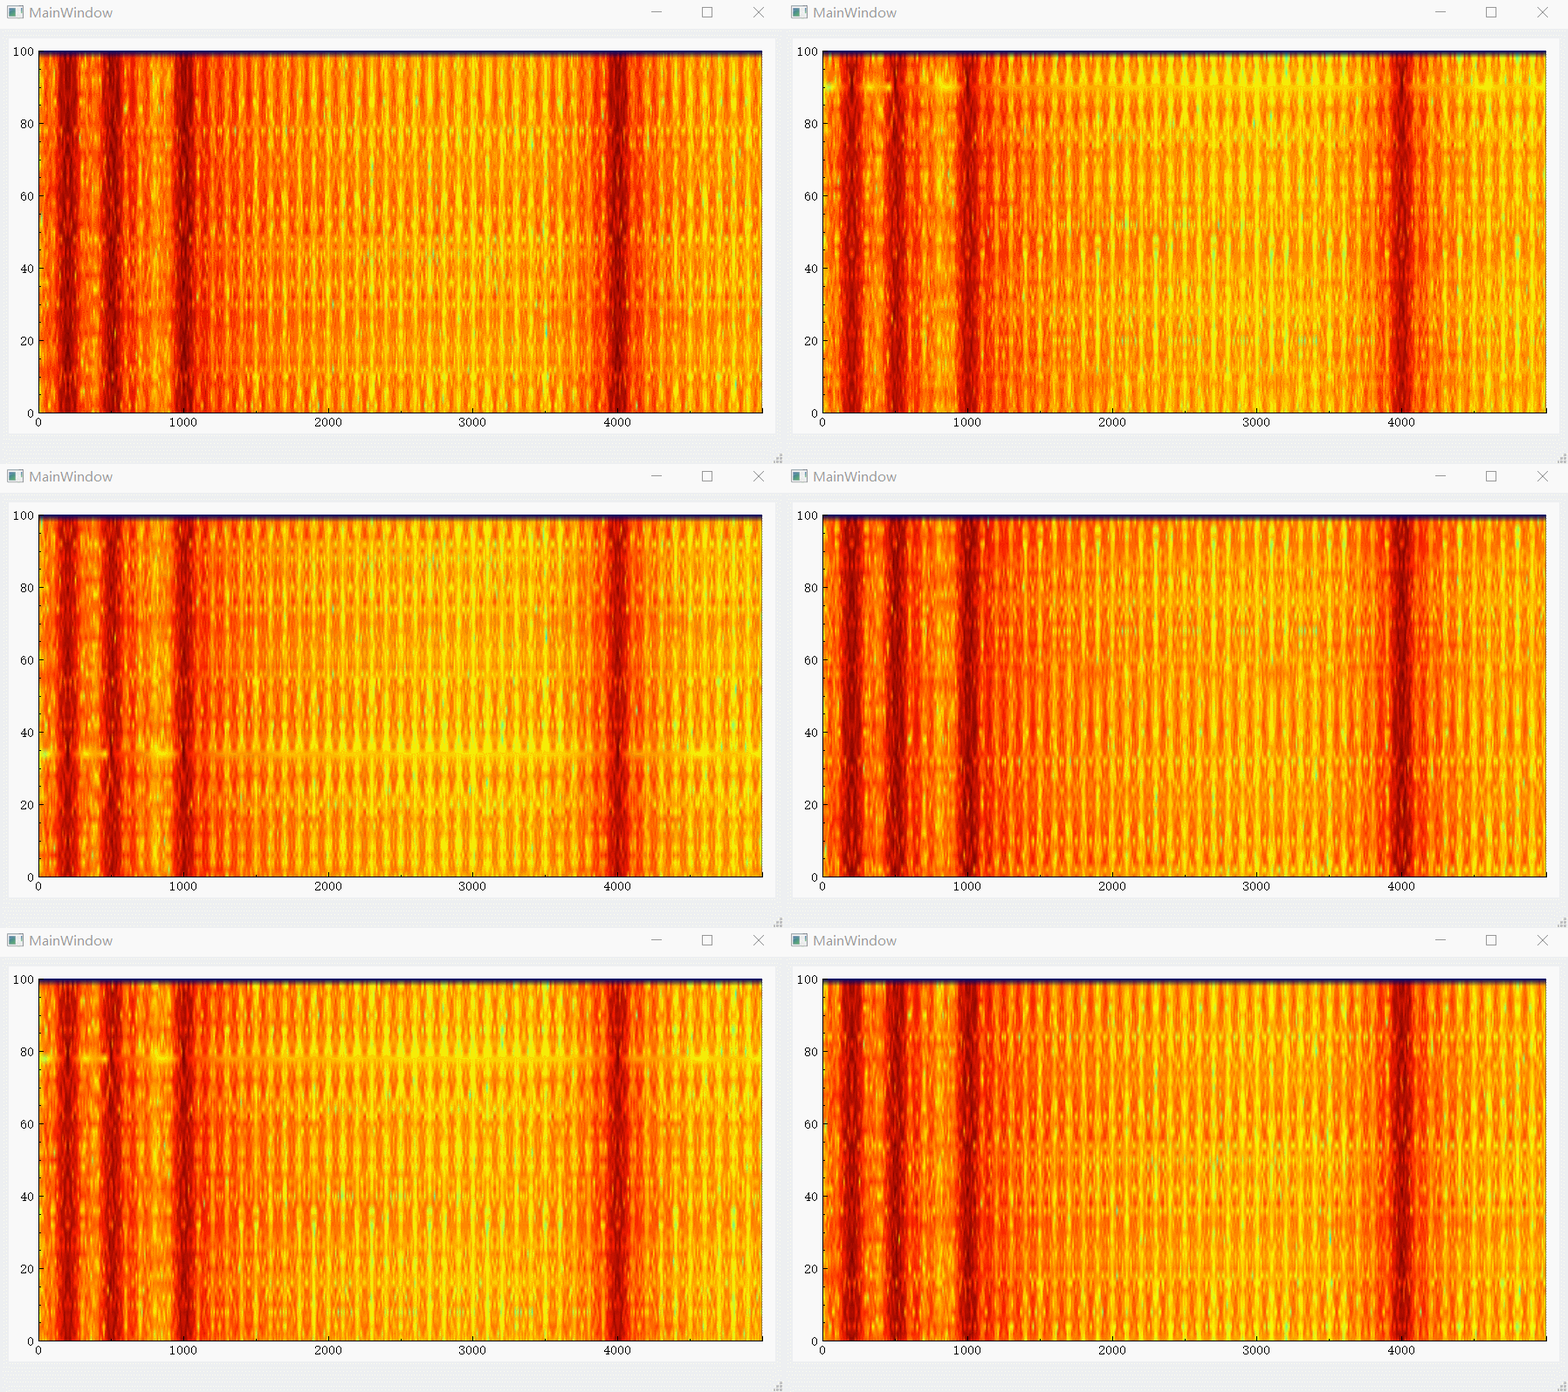
不管怎样,先放效果图:
图1 MFC+SignalLab

图2 Ipp+QcustomPlot

使用的信号是自己生成的四路BPSK信号,采样率为10kHZ,载波中心频率分别为200Hz、500Hz、1kHz、4kHz,由于没有加升余弦成型(或者说是矩形成型),导致旁瓣能量很强,不过这不是这次重点。
在第二种方式实现过程中,有关QCustomPlot的操作参考CSDN博客《QT5 使用QCustomplot绘制频谱瀑布图并封快速傅里叶变换fft类》,投下链接:
QT5 使用QCustomplot绘制频谱瀑布图并封快速傅里叶变换fft类
二、MFC + SignalLab
首先记录关于SignalLab,这是一个类似于信号工具箱的东西,能够完成信号时域图、频域图、瀑布图的动态展示,以及滤波器设计等各种处理工作。我没有对它进行很仔细的了解,仅仅是借用了它的画图功能。关于SignalLab的配置与上手,可以参考安装后的帮助pdf,基本上就是手把手教学了。

放下代码:
在.h里包含头文件、声明类成员:
#include <CSLPlayer.h>
#include <CSLFourier.h>
#include <CSLWaterfall.h>

protected:
	CTSLPlayer		SLPlayer;
	CTSLFourier		SLFourier;
	CTSLWaterfall	SLWaterfall;
在.cpp里的OnInitDialog()里添加代码:
// TODO: Add extra initialization here
	SLWaterfall.Open( m_Waterfall.m_hWnd );

	SLPlayer.FileName = "D:\\data\\test_fs10k_double.dat";

	SLPlayer.Mode = CTSLPlayerMode::pmRepeat;
	SLPlayer.SampleRate = 8*10*pow(10,3);		// 10k
	SLPlayer.OutputPin.Connect(SLFourier.InputPin);

	SLFourier.IgnoreDC = true;
	SLFourier.Order = 10;	// FFT阶数,2的order次幂

	SLFourier.SpectrumOutputPin.Connect( SLWaterfall.InputPin );

	VCL_Loaded();
在.cpp里的OnClose ()里添加代码:
SLPlayer.Stop();搞定!
其中,图形显示在一个Static Text里,它的control变量就是代码里的m_Waterfall。SignalLab给我的感觉就像是经过一个个模块,设置好每个模块的Input和Output就工作了。
这里面的的几个“坑”:1、SignalLab的输入数据是double类型的。很多常见的PCM波形量化后是int8或者int16,需要先转为double类型后再送进SignalLab。我这里直接用Matlab输出为double的数据文件了,这是一种偷懒的方式。2、在player的采样率设置为原采样率,其显示出来的频率是不正确的,我将player的采样率设置为原采样率8倍(即80kHz),频率轴正确,导致这个结果的原因还没搞明白。如果有高手还望指点。
这个demo中,我直接偷懒把文件当成输入了,后续改进需要把数据缓冲区的某个double数组作为输入更符合实际情况。
三、Ipp+QCustomPlot
QCustomPlot是Qt的一个库,需要到官网下载,实际上就是一个.h和.cpp。用VS创建工程后,再包含qcustomplot.h和qcustomplot.cpp,有时总出错。
这里我的建议是创建工程时,用Qt Creator 来创建,然后在工程文件.pro包含qcustomplot.h和qcustomplot.cpp就好,非常方便。调试时,再用VS打开Qt工程,这样调试起来也很舒服。
还有就是这次做fft使用的是Ipp库。包含Ipp库的方式,CSDN上有,网上也有大佬分享,这里就不再赘述(当然是使用VS来包含Ipp库的环境,Qt来做的话,本人把握不住)。
在UI界面添加一个Widget,并提升为QcustomPlot类,在这个工程中,这个部件直接就命名为widget。放下代码:
mainwindow.h:
#ifndef MAINWINDOW_H
#define MAINWINDOW_H

#include <QMainWindow>
#include <QTimer>
#include "qcustomplot.h"

namespace Ui {
class MainWindow;
}

class MainWindow : public QMainWindow
{
    Q_OBJECT

public:
    explicit MainWindow(QWidget *parent = 0);
    ~MainWindow();

	void widget_tf_init();
	void get_file_length();
	void file_read();
	void fft();
	void widget_tf_paint();

private:
    Ui::MainWindow *ui;

	QTimer dataTimer;
	QCPColorMap *m_pColorMap;
	int fileLength;
	int pos;
	short* data_s;
	int fftOrder;
	int fftPoint;
	int outSpecturmDataLength;
	float* specturmData;
	QList<QVector<float> > value_lofar;

private slots:
	void data_update();
};

#endif // MAINWINDOW_H
mainwindow.cpp:
#include "mainwindow.h"
#include "ui_mainwindow.h"

#include <string>
#include <iostream>
#include <fstream>

#include <ipp.h>
#include <ippcore.h>

using namespace std;

#pragma comment(lib,"ipps.lib")
#pragma comment(lib,"ippsc.lib")
#pragma comment(lib,"ippsr.lib")

MainWindow::MainWindow(QWidget *parent) :
    QMainWindow(parent),
    ui(new Ui::MainWindow)
{
    ui->setupUi(this);

	fftOrder = 10;
	fftPoint = (int)pow(2.0, fftOrder);		//FFT 点数;
	outSpecturmDataLength = fftPoint / 2;	//输出数据长度
	specturmData = new float[outSpecturmDataLength];	// 频率特性log()后的最终结果
	get_file_length();
	data_s = new short[fileLength / 2];
	file_read();
	pos = 0;
	widget_tf_init();
	// 设置一个计时器,重复调用MainWindow::update()
	connect(&dataTimer, SIGNAL(timeout()), this, SLOT(data_update()));
	dataTimer.start(0); // 间隔0表示尽可能快地刷新

}

MainWindow::~MainWindow()
{
    delete ui;
}

void MainWindow::widget_tf_init()
{
	//ui->widget->setInteractions(QCP::iRangeDrag | QCP::iRangeZoom);//可拖拽+可滚轮缩放
	float fs = 10000;	// 采样率10kHz
	m_pColorMap = new QCPColorMap(ui->widget->xAxis, ui->widget->yAxis);
	m_pColorMap->data()->setSize(outSpecturmDataLength+1, 51);//设置整个图(x,y)点数
	m_pColorMap->data()->setRange(QCPRange(0, fs*outSpecturmDataLength/fftPoint), QCPRange(0, 100));//setRange是设置X轴以及Y轴的范围
	m_pColorMap->setGradient(QCPColorGradient::gpJet);//设置默认渐进色变化(可在QCPColorGradient中查看)
	m_pColorMap->rescaleDataRange(true);
	// 立即刷新图像
	ui->widget->rescaleAxes();//自适应大小
	ui->widget->replot();
}

void MainWindow::get_file_length()
{
	// 打开文件
	string path_r = "D:\\data\\test_fs10k.dat";
	ifstream file_in = ifstream(path_r, ios::binary);
	// 获取文件大小
	long long Beg = file_in.tellg();
	file_in.seekg(0, ios::end);
	long long End = file_in.tellg();
	fileLength = (int)(End - Beg);	// 字节数
	file_in.seekg(0, ios::beg);
	file_in.close();
}

void MainWindow::file_read()
{
	// 打开文件
	string path_r = "D:\\data\\test_fs10k.dat";
	ifstream file_in = ifstream(path_r, ios::binary);

	char* data = new char[fileLength];
	file_in.read(data, fileLength);

	memcpy(data_s, data, fileLength);

	delete[] data;
	file_in.close();
}

void MainWindow::data_update()
{
	fft();
	widget_tf_paint();
}

void MainWindow::fft()
{
	IppStatus status;
	int samplePoint = fftPoint;
	IppsFFTSpec_R_32f* spec;
	// 设置输入数组
	Ipp32f *fData = ippsMalloc_32f(samplePoint);//转为浮点数,ipp输入数组
	short* ip = data_s;
	ip = ip + pos;
	if (pos + samplePoint > fileLength / 2)
	{
		pos = 0;
		ip = data_s;
	}
	memset(fData, 0, sizeof(Ipp32f)*samplePoint);
	ippsConvert_16s32f(ip, fData, samplePoint);
	// 设置输出数组
	Ipp32f *X = ippsMalloc_32f(fftPoint);					// ff()后的数据
	memset(X, 0, sizeof(Ipp32f)*fftPoint);
	Ipp32f *mag = ippsMalloc_32f(outSpecturmDataLength);    // abs()后的幅度数据
	memset(mag, 0, sizeof(Ipp32f)*outSpecturmDataLength);

	memset(specturmData, 0, sizeof(Ipp32f)*outSpecturmDataLength);
	// 初始化
	status = ippsFFTInitAlloc_R_32f(&spec, fftOrder, IPP_FFT_DIV_INV_BY_N, ippAlgHintNone);
	// fft
	status = ippsFFTFwd_RToCCS_32f(fData, X, spec, NULL);
	// abs
	ippsMagnitude_32fc((Ipp32fc*)X, mag, outSpecturmDataLength);
	// log
	ippsLn_32f_I(mag, outSpecturmDataLength);				// 求Ln,因为IPP函数不支持浮点的10Log10计算这里通过Ln进行转换计算
	ippsDivC_32f_I(2.3026, mag, outSpecturmDataLength);		// log(e,10)=2.3026
	ippsMulC_32f_I(10.0, mag, outSpecturmDataLength);		// 10log10
	memcpy(specturmData, mag, sizeof(Ipp32f)*outSpecturmDataLength);

	// 记录位置
	pos = pos + samplePoint;

	ippsFFTFree_R_32f(spec);
	ippsFree(fData);
	ippsFree(X);
	ippsFree(mag);
	// delete ip;
}

void MainWindow::widget_tf_paint()
{
	if (value_lofar.size()>49)
	{
		value_lofar.removeLast();  //当lofar累积到了50个,删除最后面的数据,防止绘图溢出绘图区域
	}
	QVector<float> temp = QVector<float>(outSpecturmDataLength);
	copy(specturmData, specturmData + outSpecturmDataLength, begin(temp));
	value_lofar.prepend(temp);//新来的数据一直往前面累加
	for (int i = 0; i<value_lofar.size(); i++)
	{
		for (int j = 0; j < outSpecturmDataLength; j++)
		{
			m_pColorMap->data()->setCell(j, i, value_lofar[i][j]);
		}
	}
	m_pColorMap->rescaleDataRange(true);
	ui->widget->rescaleAxes();	//自适应大小
	ui->widget->replot();
}
搞定!
这个demo还是有很大改进空间的,比如图片的刷新率,能够保证进入1ms的信号,画面更新的是1ms的内容,而不是这个demo,计算出结果立刻刷新。
四、结语
不管咋样,这两个demo是做出来了。我也没有想到我这种懒人竟然能一年两更了。“不务正业”系列也算是我假期时的乐子,希望以后也能继续更新。
如果有想要demo代码的朋友,私我就好,我就不发在资源区里骗积分了,我也不想因为在别的环境下调试不通的问题来做售后。
当然,如果有大佬看到本文,欢迎做出批评指正!有的时候真的是靠大佬一句就能点醒的问题,自己需要想好久,甚至怎么想都想不通。欢迎在评论区留言!


