数据可视化展示除了静态数据的展示,还有动态数据的实时更新。博主通过阅读chart.js的api,总结了以下两种方法:
方法1、直接更新图表的数据集
this.mydata_1=[7,22,18,24,10,30];//获取新数据
this.myChart.data.datasets[0].data = this.mydata_1;//数据集数据更新
this.myChart.update();//图表更新
方法2、清除原图表,生成新图表
this.myChart.destroy();//原图表清除
this.mydata_1=[7,22,18,24,10,30]//获取新数据
this.get10();//初始化生成新图表
数据更新样例:
1)折线图
1-方法2
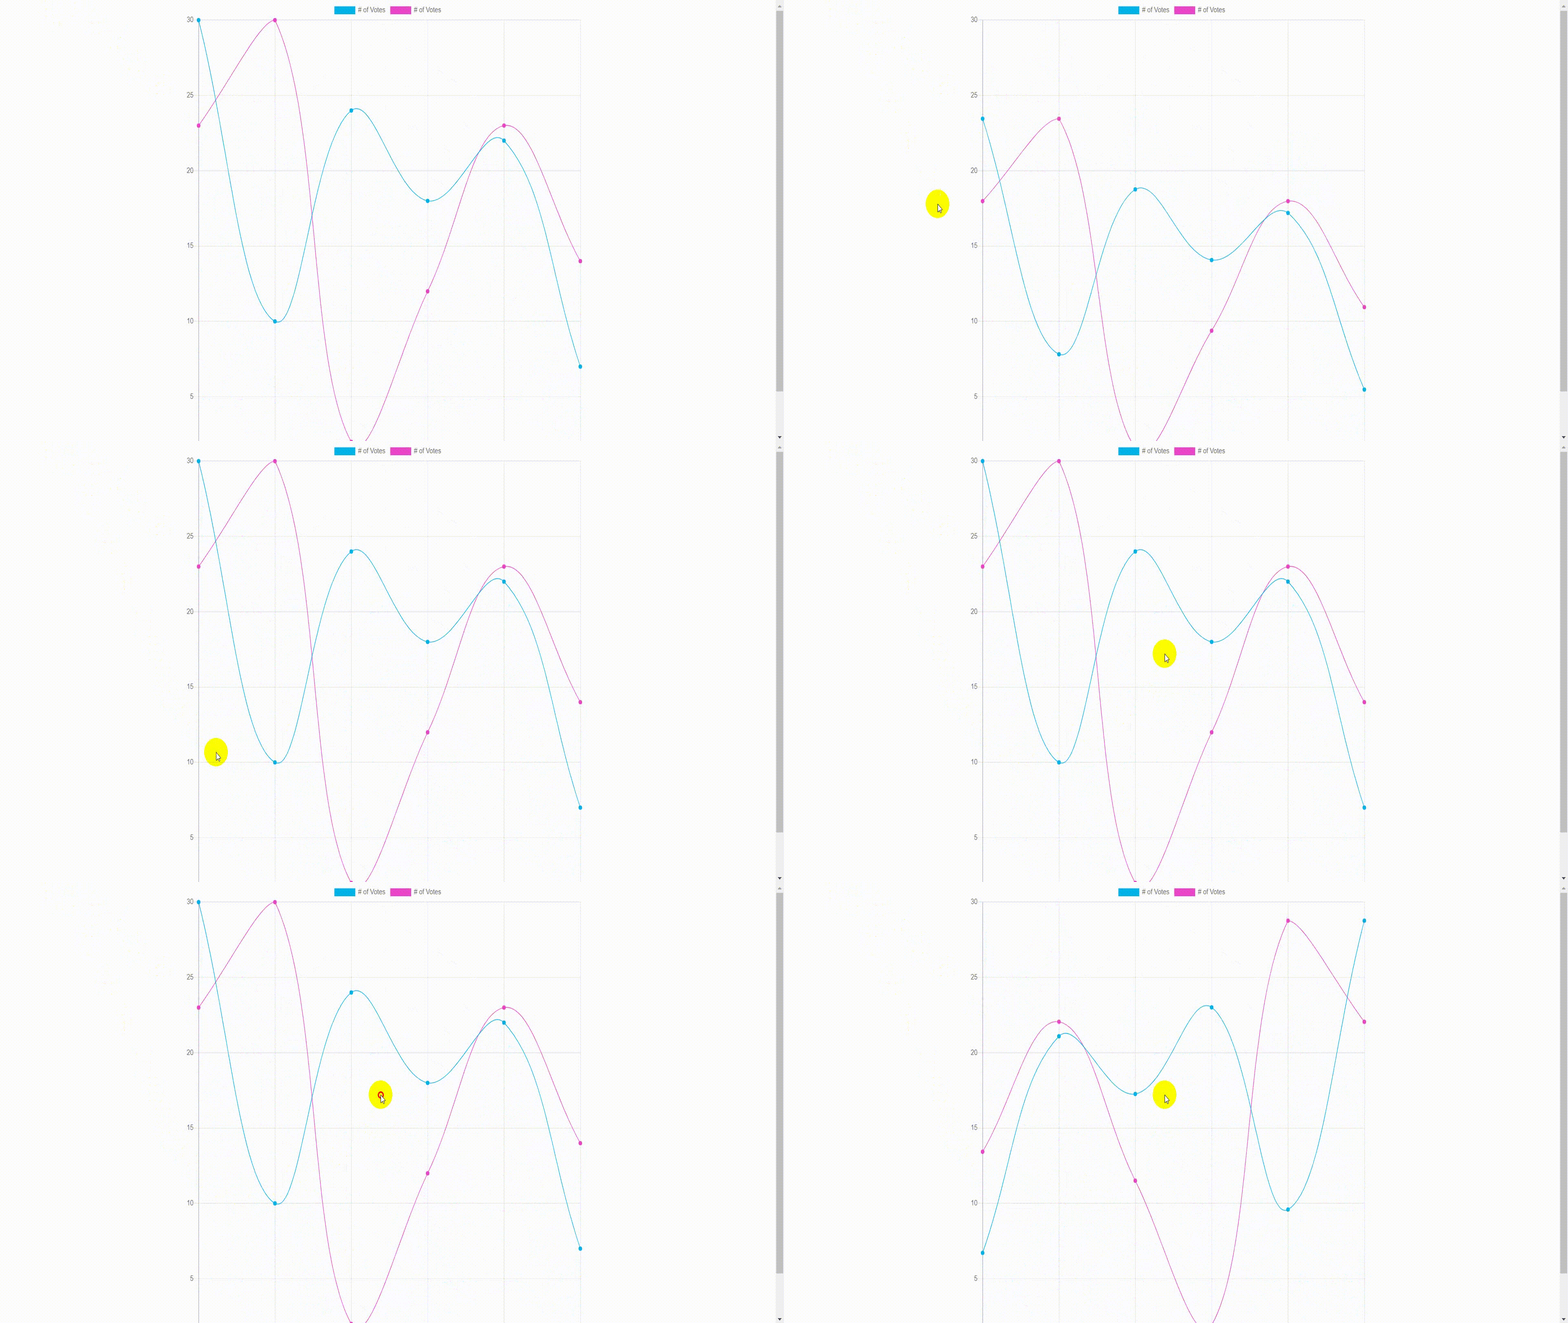
<template>
    <div class="container">
        <div class="w" @click="get">
            <canvas id="myChart10" width="100" height="100"></canvas>
        </div>
    </div>
</template>

<script>
    export default {
        name: "Charts",
        data(){
            return {
                myChart: "",
                mydata_1:[30,10,24,18,22,7],
                mydata_2:[23,30,2,12,23,14],
            }
        },
        mounted(){
            this.get10();
        },
        methods:{
            get(){
                this.myChart.destroy();
                this.mydata_1=[7,22,18,24,10,30];
                this.mydata_2=[14,23,12,2,30,23];
                this.get10();
            },
            get10() {
                let ctx = document.getElementById("myChart10");
                this.myChart = new Chart(ctx, {
                    type: 'line',
                    data: {
                        labels: ['Red', 'Blue', 'Yellow', 'Green', 'Purple', 'Orange'],
                        datasets: [
                            {
                                label: '# of Votes',
                                data: this.mydata_1,
                                fill:false,
                                backgroundColor: 'rgb(0,179,235,0.4)',
                                borderColor: 'rgb(0,179,235)',
                                pointBackgroundColor:'rgb(0,179,235)',
                                borderWidth: 1,
                                order:1,
                            },
                            {
                                label: '# of Votes',
                                data: this.mydata_2,
                                fill:false,
                                backgroundColor: 'rgb(235,69,201,0.4)',
                                borderColor: 'rgb(235,69,201)',
                                pointBackgroundColor:'rgb(235,69,201)',
                                borderWidth: 1,
                                order:1,
                            },
                        ],
                    },
                    options:options,
                });
            },
        }
    }
</script>
2-方法1
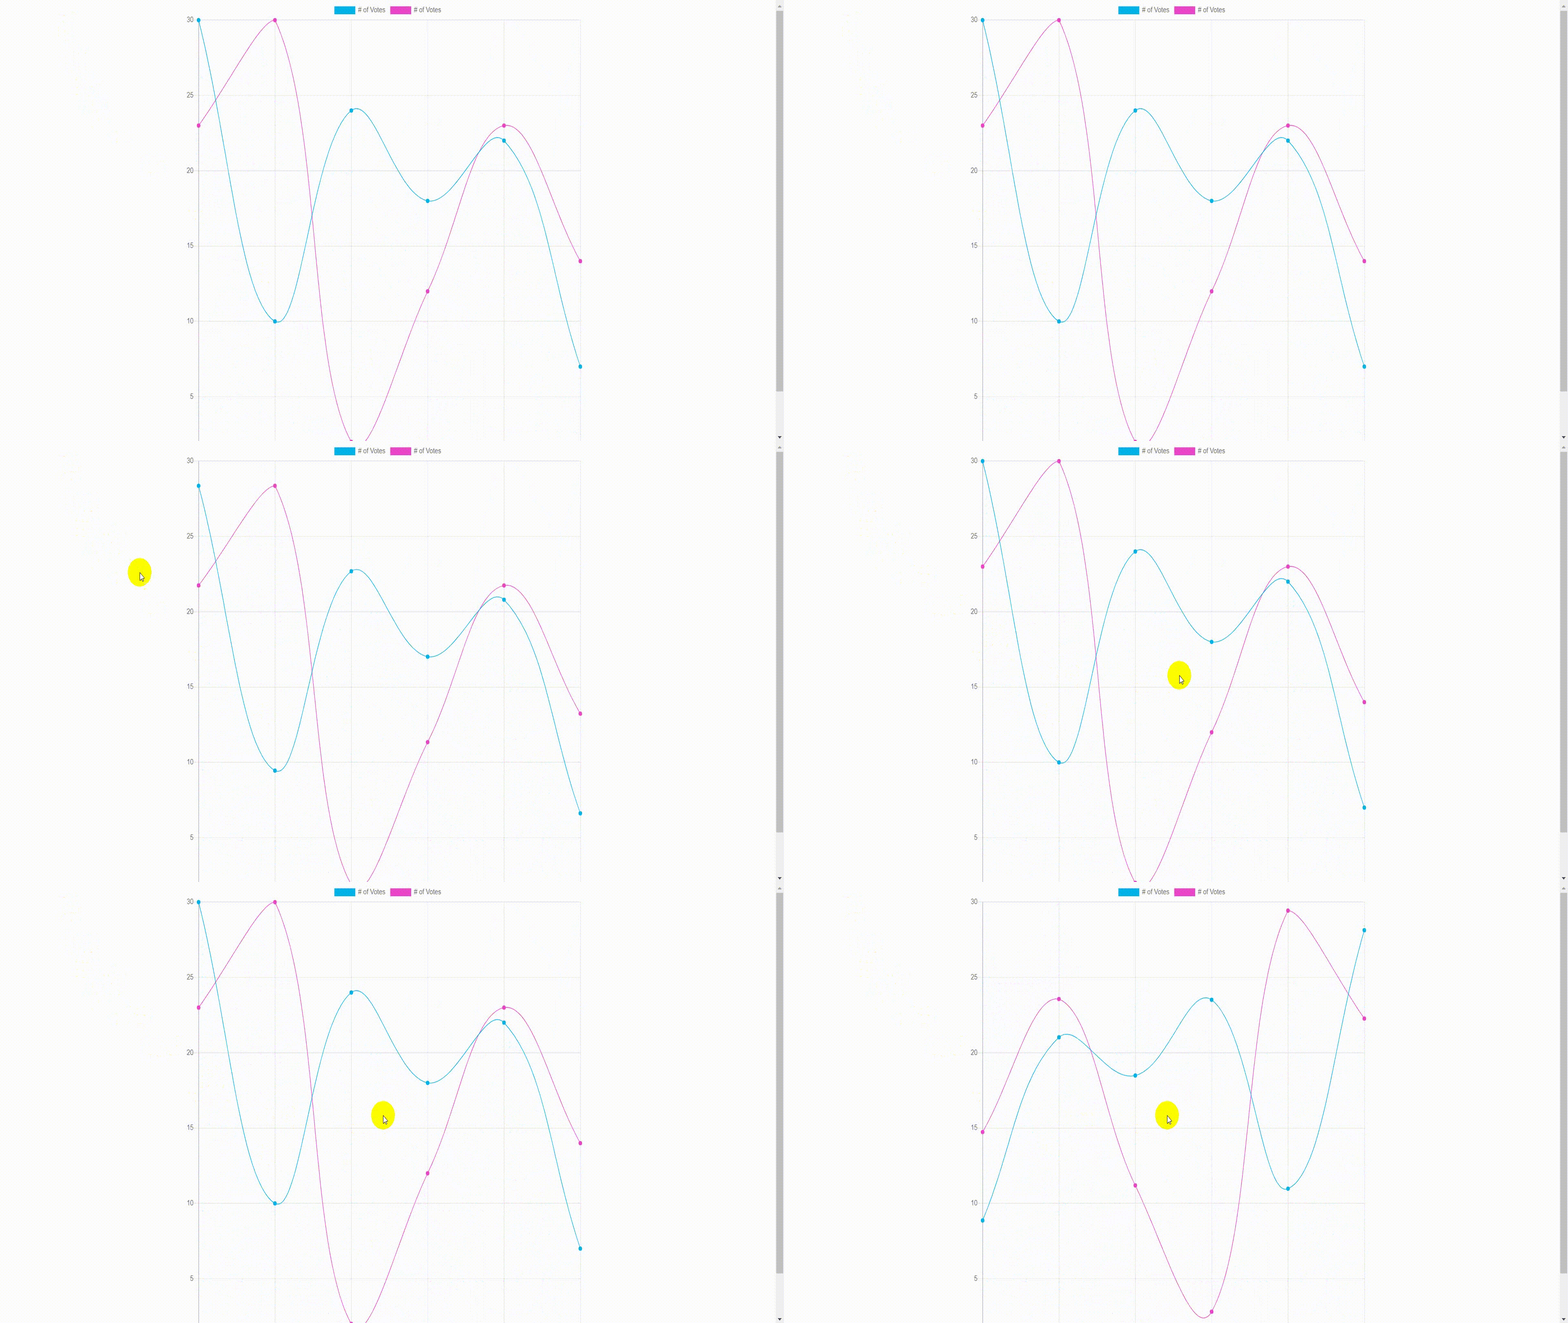
<script>
    export default {
        methods:{
            get(){
                this.mydata_1=[7,22,18,24,10,30];
                this.myChart.data.datasets[0].data = this.mydata_1;
                this.mydata_2=[14,23,12,2,30,23];
                this.myChart.data.datasets[1].data = this.mydata_2;
                this.myChart.update();
            },
        }
    }
</script>
2)柱状图
1-方法2
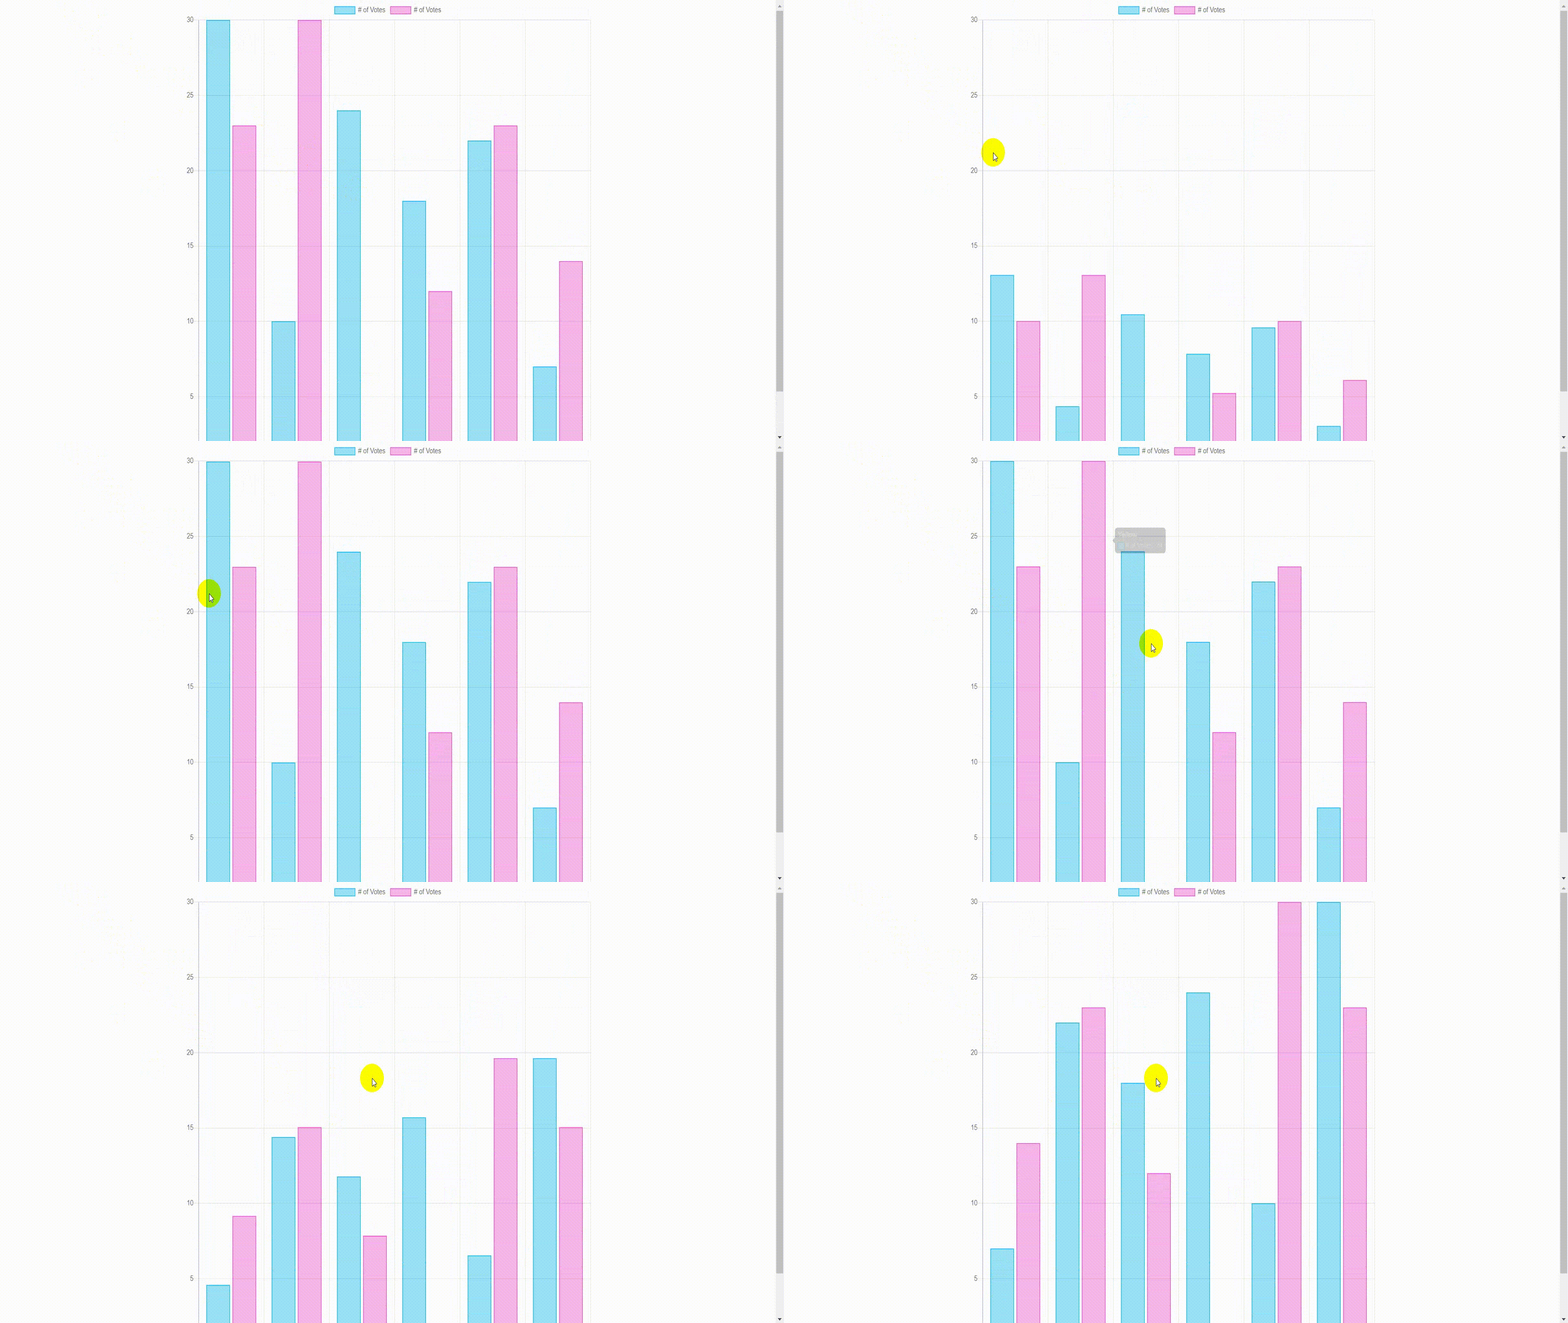
<script>
    export default {
        methods:{
            get(){
                this.myChart.destroy();
                this.mydata_1=[7,22,18,24,10,30];
                this.mydata_2=[14,23,12,2,30,23];
                this.get10();
            },
            get10() {
                let ctx = document.getElementById("myChart10");
                this.myChart = new Chart(ctx, {
                    type: 'bar',
                    data: data,
                    options:options,
                });
            },
        }
    }
</script>
2-方法1
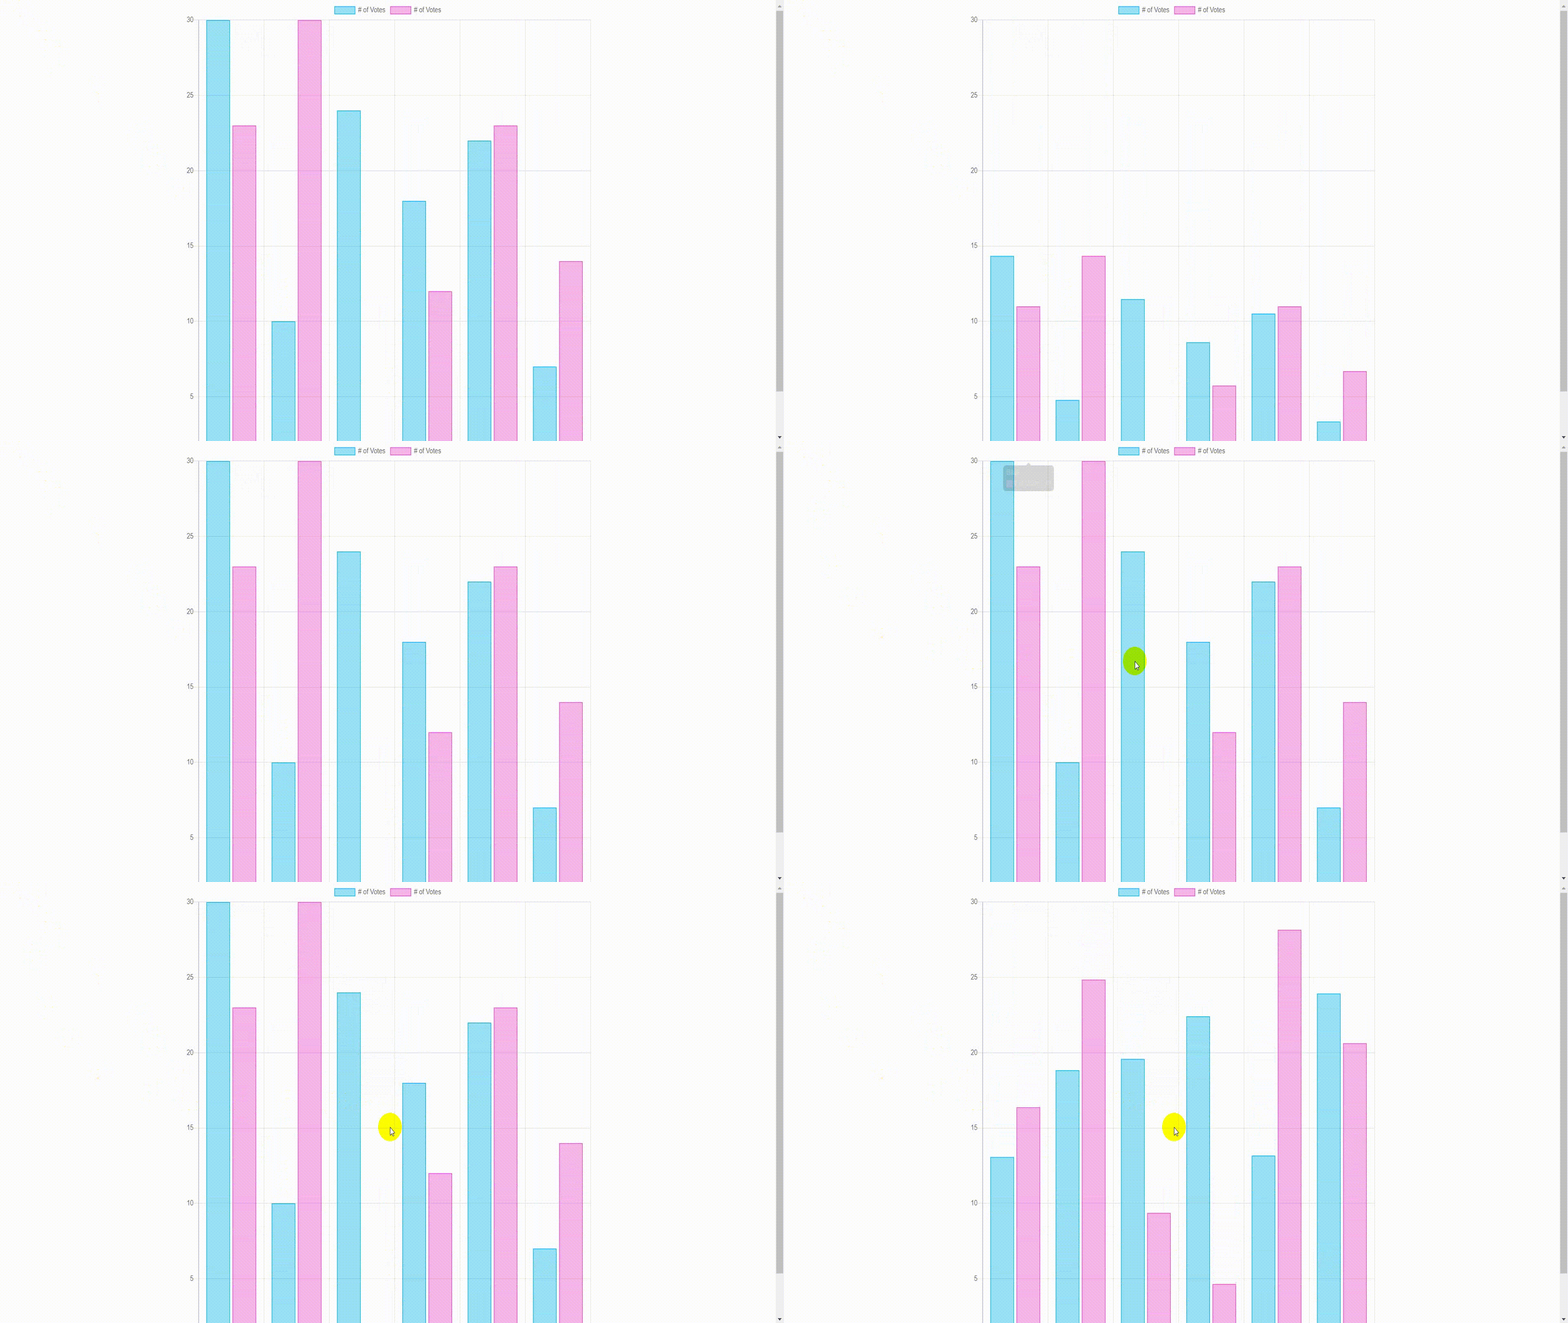
<script>
    export default {
        methods:{
            get(){
                this.mydata_1=[7,22,18,24,10,30];
                this.myChart.data.datasets[0].data = this.mydata_1;
                this.mydata_2=[14,23,12,2,30,23];
                this.myChart.data.datasets[1].data = this.mydata_2;
                this.myChart.update();
            },
        }
    }
</script>
3)雷达图
1-方法2
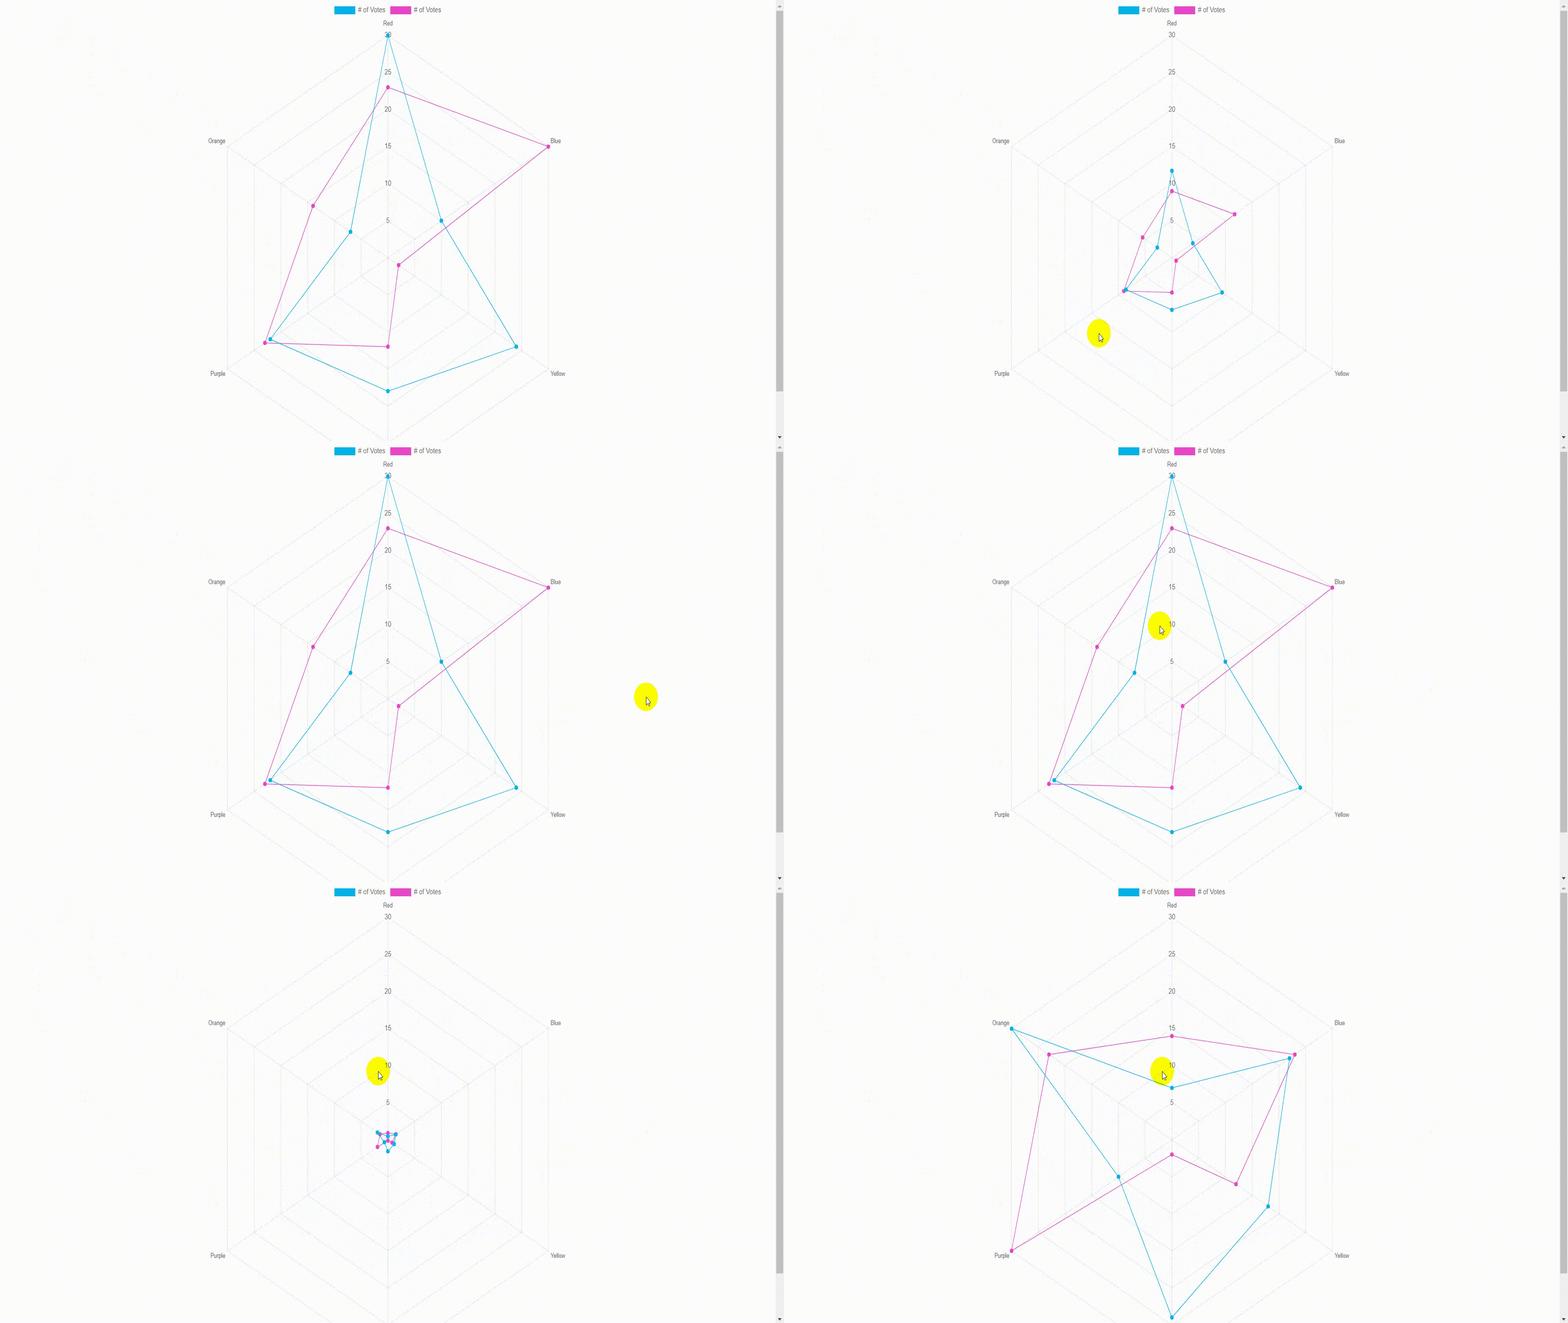
<script>
    export default {
        methods:{
            get(){
                this.myChart.destroy();
                this.mydata_1=[7,22,18,24,10,30];
                this.mydata_2=[14,23,12,2,30,23];
                this.get10();
            },
            get10() {
                let ctx = document.getElementById("myChart10");
                this.myChart = new Chart(ctx, {
                    type: 'radar',
                    data: data,
                    options:options,
                });
            },
        }
    }
</script>
2-方法1
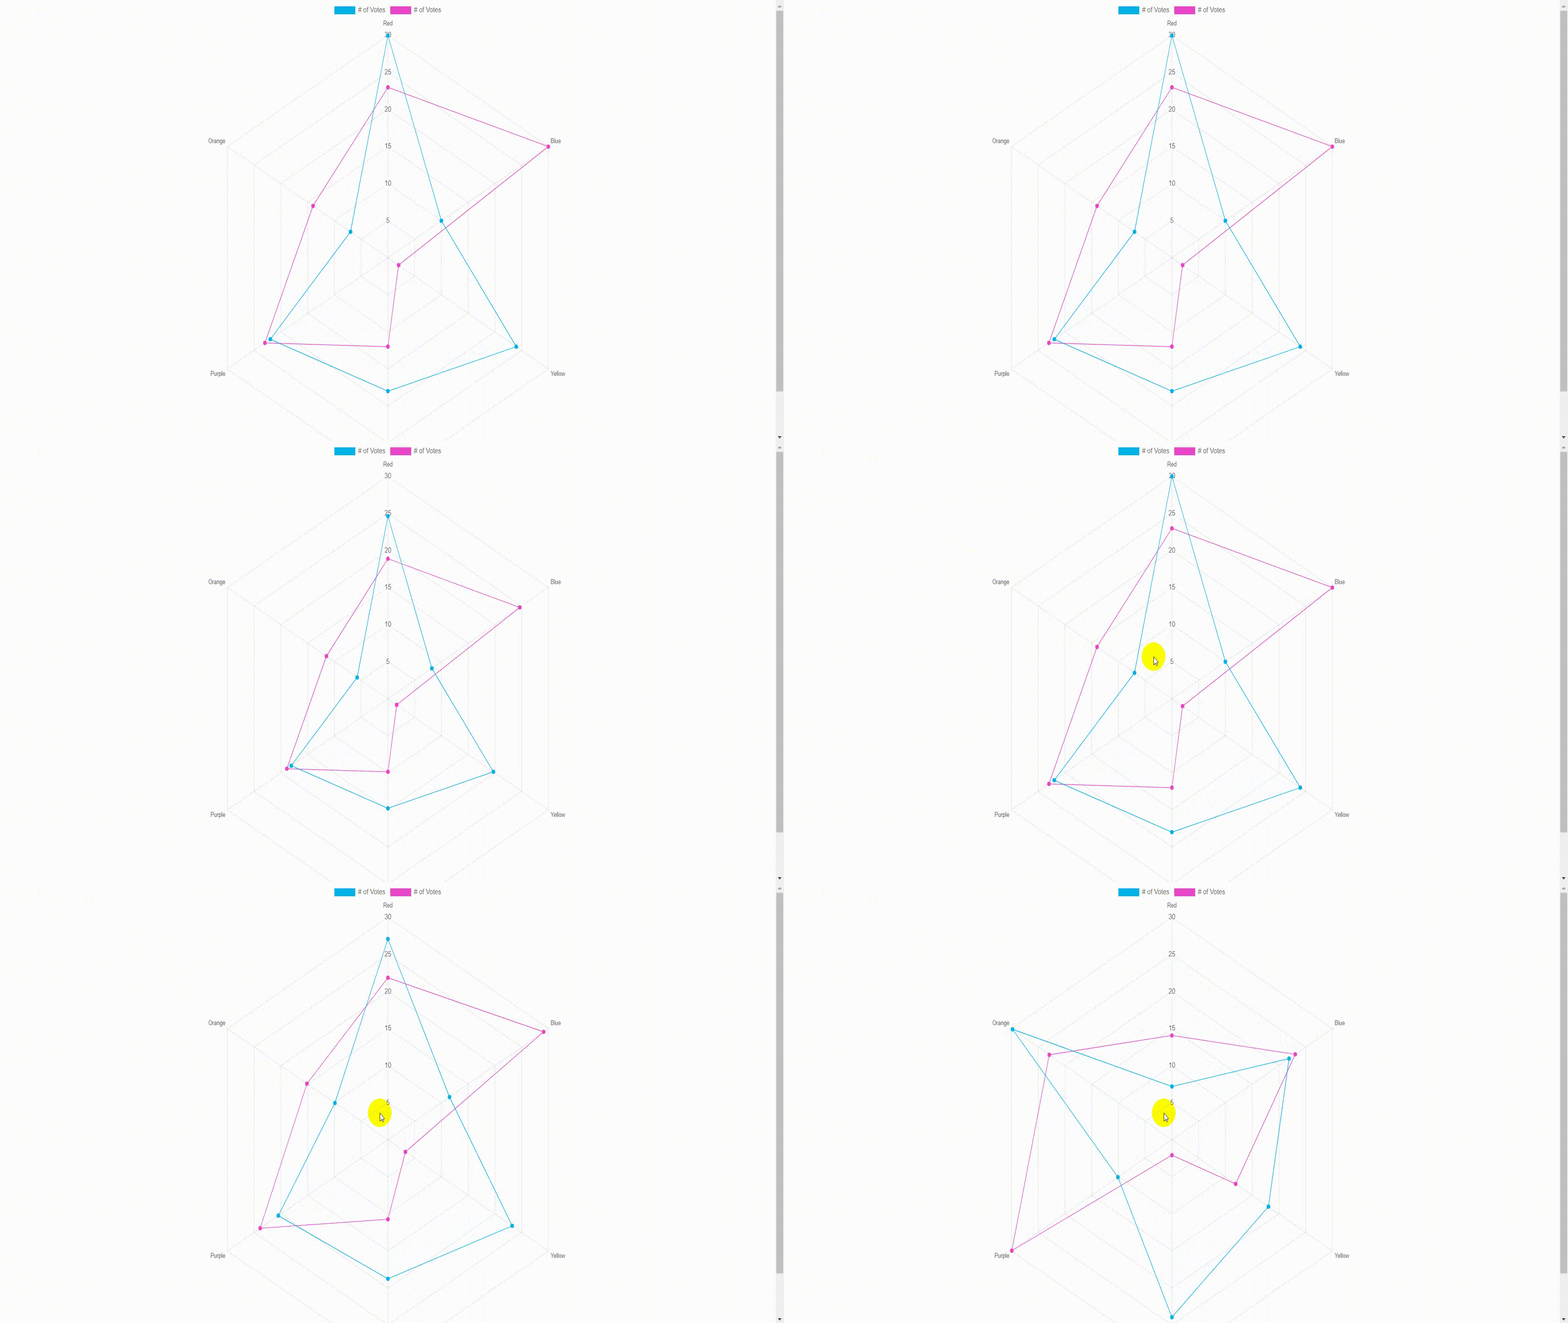
<script>
    export default {
        methods:{
            get(){
                this.mydata_1=[7,22,18,24,10,30];
                this.myChart.data.datasets[0].data = this.mydata_1;
                this.mydata_2=[14,23,12,2,30,23];
                this.myChart.data.datasets[1].data = this.mydata_2;
                this.myChart.update();
            },
        }
    }
</script>


