
LINUX时经常会遇到系统IO占用很高,系统IO占用可以使用iostat -x 1查看
但很多时候知道磁盘IO负载高,但并不知道是什么程序占用的,是PHP,还是MYSQL,还是其它的,这就不好查看了。iotop工具可以实现
以ubuntu为例:
安装
root@ubuntu:~# apt-get install iotop
安装完成后
执行iotop
就可以看到类似top一样的显示 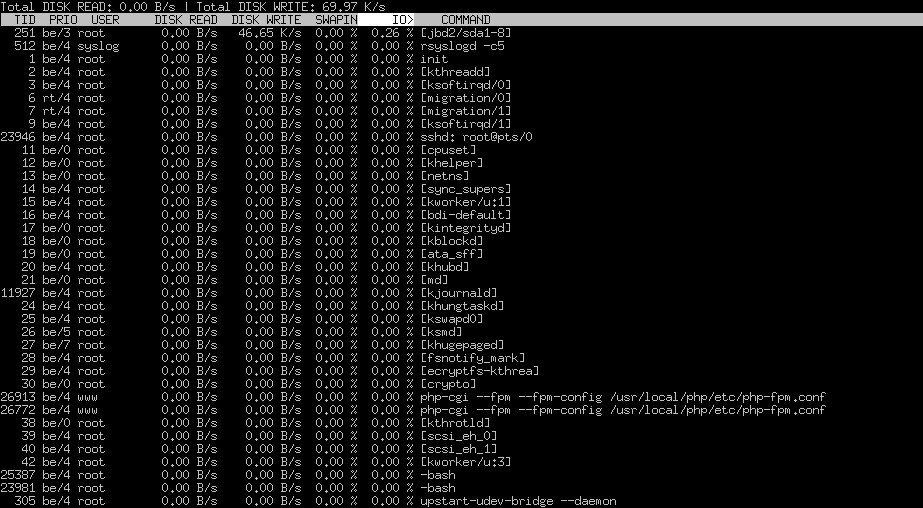
iotop 详细参数:
root@ubuntu:~# iotop -h
unable to set locale, falling back to the default locale
Usage: /usr/bin/iotop [OPTIONS]
DISK READ and DISK WRITE are the block I/O bandwidth used during the sampling
period. SWAPIN and IO are the percentages of time the thread spent respectively
while swapping in and waiting on I/O more generally. PRIO is the I/O priority at
which the thread is running (set using the ionice command).
Controls: left and right arrows to change the sorting column, r to invert the
sorting order, o to toggle the –only option, p to toggle the –processes
option, a to toggle the –accumulated option, q to quit, any other key to force
a refresh.
Options:
–version show program’s version number and exit
-h, –help show this help message and exit
-o, –only only show processes or threads actually doing I/O
-b, –batch non-interactive mode
-n NUM, –iter=NUM number of iterations before ending [infinite]
-d SEC, –delay=SEC delay between iterations [1 second]
-p PID, –pid=PID processes/threads to monitor [all]
-u USER, –user=USER users to monitor [all]
-P, –processes only show processes, not all threads
-a, –accumulated show accumulated I/O instead of bandwidth
-k, –kilobytes use kilobytes instead of a human friendly unit
-t, –time add a timestamp on each line (implies –batch)
-q, –quiet suppress some lines of header (implies –batch)
-p 指定进程ID,显示该进程的IO情况
-u 指定用户名,显示该用户所有的进程IO情况


