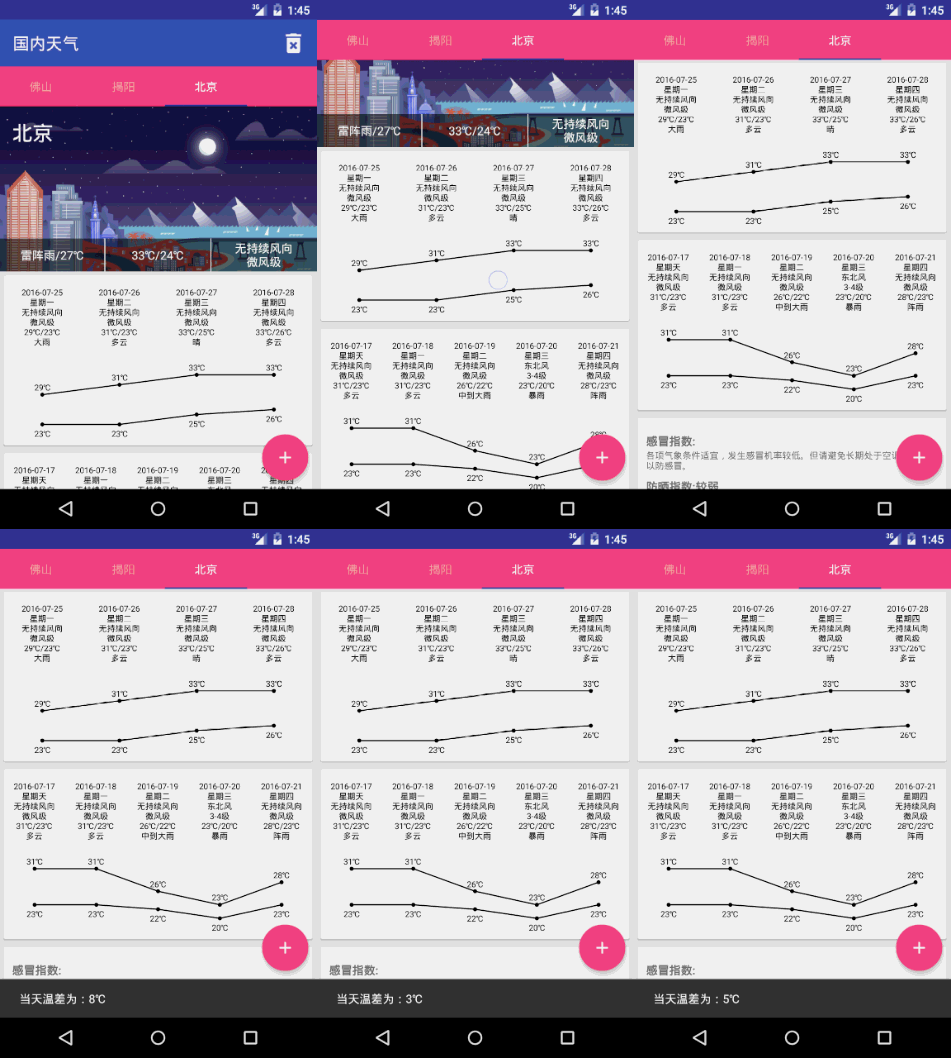
之前写了个天气APP,带4天预报和5天历史信息。所以想着要不要加一个折线图来显示一下天气变化趋势,难得有空,就写了一下,这里做些记录,脑袋不好使容易忘事。
先放一下效果:

控件内容比较简单,就是一个普通的折线图,上下分别带有数字,点击的时候显示当天温度的差值。
创建一个类继承自View,并添加两个构造方法:
public class TrendGraph extends View {
    public TrendGraph(Context context) { // 在java代码中创建调用
        super(context);
    }

    public TrendGraph(Context context, AttributeSet attrs) { // 在xml中创建调用
        super(context, attrs);
    }
}
因为这里不需要考虑wrap_content的情况,所以onMeasure方法不需重写,关键的是onDraw,而onDraw方法其实也不困难,只需要确定好每个点的具体位置就好,因为连线也是需要点的坐标,代码比较啰嗦,可以略过:
1     @Override
 2     protected void onDraw(Canvas canvas) {
 3         super.onDraw(canvas);
 4         if (mElements == null || mElements.size() == 0) {
 5             return;
 6         }
 7         double max_up = getMaxUp();
 8         double min_down = getMinDown();
 9         canvas.setDrawFilter(mDrawFilter);
10         mPaint.setStrokeWidth(lineWeith);
11         float width = getWidth();
12         float grap = width / mElements.size();
13         float textSize = mTextPaint.getTextSize();
14         int textMargin = circleRadius * 2;
15         float margin_top = textSize + 2 * textMargin;
16         Log.d(TAG, "onDraw: " + margin_top + "|" + textSize);
17         float height = getHeight() - 2 * margin_top;
18
19         for (int i = 0; i < mElements.size() - 1; i++) {
20             float startX = i * grap + grap / 2;
21             float stopX = (i + 1) * grap + grap / 2;
22             float startY = (float) (max_up - mElements.get(i).getUp()) / (float) (max_up -
23                     min_down) * height + margin_top;
24             float stopY = (float) (max_up - mElements.get(i + 1).getUp()) / (float) (max_up -
25                     min_down) * height + margin_top;
26
27             canvas.drawText((int) mElements.get(i).getUp() + "℃", startX - textSize, startY -
28                     textMargin, mTextPaint);
29             canvas.drawCircle(startX, startY, circleRadius, mPaint);
30             canvas.drawLine(startX, startY, stopX, stopY, mPaint);
31             if (i == mElements.size() - 2) {
32                 canvas.drawText((int) mElements.get(i + 1).getUp() + "℃", stopX - textSize, stopY
33                         - textMargin, mTextPaint);
34                 canvas.drawCircle(stopX, stopY, circleRadius, mPaint);
35             }
36
37             startY = (float) (max_up - mElements.get(i).getDown()) / (float) (max_up - min_down) *
38                     height + margin_top;
39             stopY = (float) (max_up - mElements.get(i + 1).getDown()) / (float) (max_up -
40                     min_down) * height + margin_top;
41             canvas.drawText((int) mElements.get(i).getDown() + "℃", startX - textSize, startY +
42                     textSize + textMargin, mTextPaint);
43             canvas.drawCircle(startX, startY, circleRadius, mPaint);
44             canvas.drawLine(startX, startY, stopX, stopY, mPaint);
45             if (i == mElements.size() - 2) {
46                 canvas.drawText((int) mElements.get(i + 1).getDown() + "℃", stopX - textSize,
47                         stopY + textSize + textMargin, mTextPaint);
48                 canvas.drawCircle(stopX, stopY, circleRadius, mPaint);
49             }
50         }
51     }
考虑到需要允许用户进行简单的设置,例如点的大小,文字大小等等,所以定义一些自定义属性(res/values/attr.xml):
<?xml version="1.0" encoding="utf-8"?>
<resources>
    <declare-styleable name="TrendGraph">
        <attr name="lineWidth" format="dimension"/>
        <attr name="circleRadius" format="dimension" />
        <attr name="textSize" format="dimension" />
        <attr name="textColor" format="reference" />
    </declare-styleable>
</resources>
format指该属性的格式,指定为dimension则是尺寸,取值单位是dp、sp或px等等,而reference则是引用,即一般在xml中引用其他资源的写法,如@string/app_name。还有其他类型,可以自行查找文档。
对自定义属性进行解析得到,这个解析需要在上面定义的第二个构造方法中进行,代码如下:
public TrendGraph(Context context, AttributeSet attrs) {
        super(context, attrs);
        TypedArray array = getContext().obtainStyledAttributes(attrs, R.styleable.TrendGraph);
        circleRadius = array.getDimensionPixelSize(R.styleable.TrendGraph_circleRadius, 5);
        lineWeith = array.getDimensionPixelSize(R.styleable.TrendGraph_lineWidth, 3);
        mTextPaint.setTextSize(array.getDimensionPixelSize(R.styleable.TrendGraph_textSize, 35));
        mTextPaint.setColor(array.getColor(R.styleable.TrendGraph_textColor, Color.BLACK));
        array.recycle();
    }
getDimensionPixelSize方法则是通过传入的值,转换为具体的像素(px)值,也就免去我们手动转换的麻烦。但是要注意,其中的defaultValue依然是px。
接着,就可以通过xml指定这些属性,在布局中加入命名空间:
xmlns:app="http://schemas.android.com/apk/res-auto"
则Android Studio会自动引入,并且可以补全得到,具体使用:
<com.fndroid.byweather.views.TrendGraph
        android:id="@+id/tg"
        android:layout_width="match_parent"
        app:textColor="@color/colorAccent"
        app:textSize="22sp"
        app:circleRadius="2dp"
        android:layout_height="200dp"/>
最后,添加一个事件监听,在点击View的时候进行回调:
① 定义接口:
public interface onItemClickListener{
        void onItemClick(View view, Element element);
    }
② 在View中添加接口对象,并设置setter方法:
public class TrendGraph extends View {

    private onItemClickListener mOnItemClickListener;

    // 省略代码

    public void setOnItemClickListener(onItemClickListener onItemClickListener) {
        mOnItemClickListener = onItemClickListener;
    }

}
③ 处理onTouchEvent,重写该方法,代码如下:
@Override
    public boolean onTouchEvent(MotionEvent event) {
        int viewWidth = getWidth();
        int itemWidth = viewWidth / mElements.size();
        int viewHeight = getHeight();
        boolean isMove = false; // 界面中最外层为一个NestedScrollView,所以为了避免滑动时也触发,加入变量处理

        switch (event.getAction()) {
            case MotionEvent.ACTION_MOVE:
                isMove = true;
                break;
            case MotionEvent.ACTION_UP:
                if (!isMove){ // 判断只有点击时进行回调
                    int position = (int) (event.getX() / itemWidth); // 取得点击的位置
                    mOnItemClickListener.onItemClick(this, mElements.get(position)); // 回调
                }
                break;
        }

        return true;
    }
④ 在Activity中,进行监听设置,并处理:
historyGraph.setOnItemClickListener(this);
@Override
    public void onItemClick(View view, TrendGraph.Element element) {
        int dt = (int) (element.getUp() - element.getDown());
        Snackbar.make(root, "当天温差为:" + dt + "℃", Snackbar.LENGTH_SHORT).show();
    }
效果完成!欢迎大家关注交流。


