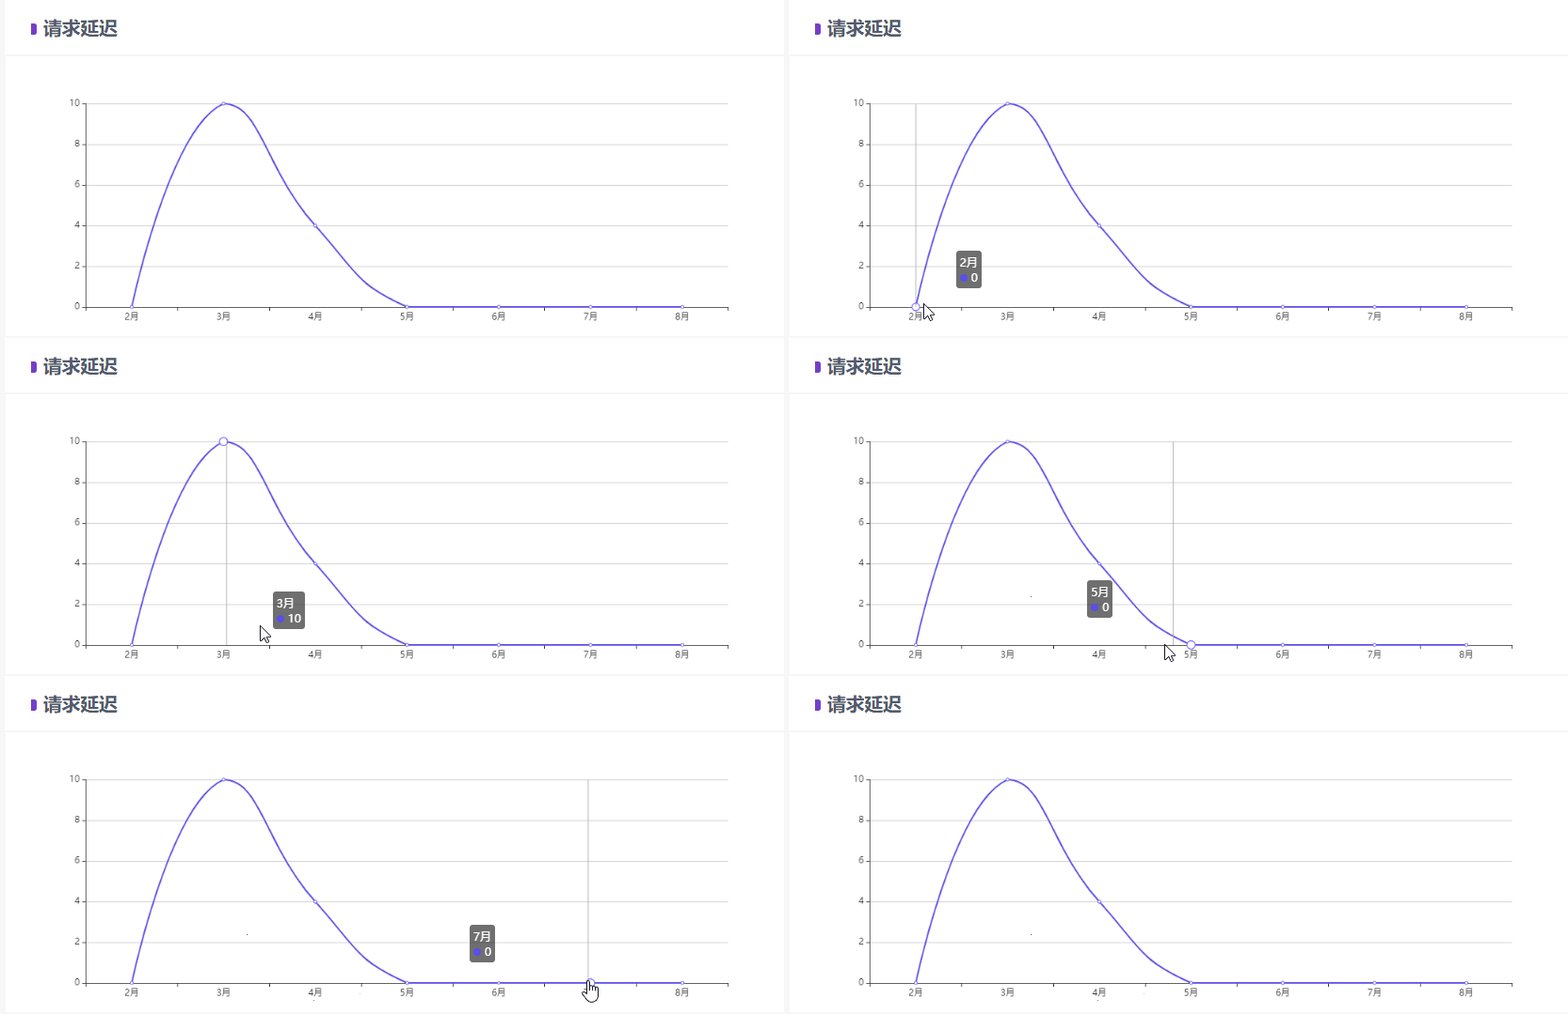
注意 👉本次演示:为折线图演示,其他图表同理。

1、定制主题
全局通用样式配置(根据业务的需求,小伙伴们 可以去定制一个属于自身业务的主题,全局可通用,省时间又好看!) 以下样式 不是唯一的。一 🎨

// tky-chart-theme.js
var echarts = require("echarts");
//"tky-chart-theme" 为在父页面 引入定制主题的名称
echarts.registerTheme("tky-chart-theme", {
  //颜色
  color: [
    "#5B4EE9",
    "#9E95FF",
    "#66C1C0",
    "#FB9455",
    "#FBD555",
    "#5B8FF9",
    "#5AD8A6",
    "#F6BD16",
    "#E86452",
    "#6DC8EC",
    "#945FB9",
    "#FF9845",
    "#1E9493",
    "#FF99C3",
    "#5D7092",
  ],
  backgroundColor: "rgba(252,252,252,0)", //背景颜色
  textStyle: {},
  //标题颜色
  title: {
    textStyle: { color: "#666666" },
    subtextStyle: { color: "#999999" },
  },
  grid: { top: 64, bottom: 40 },
  bar: { barWidth: "56%px", barMaxWidth: "30px" },
});
2、通用写法
本次演示,简化流程 以源码形式去展示,相关的代码注释 在以下文中,小伙伴们可以去仔细的查看。
<!--请求延迟-->
<template>
  <div id="requestDelay"></div>
</template>

<script>
  require("../theme/tky-chart-theme"); //引入主题
  import echarts from "echarts"; //局部引入

  export default {
    name: "requestDelay",
    data() {
      return {
        xData: ["2月", "3月", "4月", "5月", "6月", "7月", "8月"],
        yData: [0, 10, 4, 0, 0, 0, 0],
      };
    },
    mounted() {
      this.getInfoNumberOfRequests();
    },
    methods: {
      getInfoNumberOfRequests() {
        var accessToElements = document.getElementById("requestDelay"); //绑定元素
        var themeStyle = echarts.init(accessToElements, "tky-chart-theme"); //定制主题
        // 绘制图表
        var option = {
          tooltip: {
            trigger: "axis",
          },
          xAxis: {
            type: "category",
            data: this.xData,
          },
          yAxis: {
            type: "value",
          },
          series: [
            {
              data: this.yData,
              type: "line",
              smooth: true,//圆滑状态
            },
          ],
        };
        option && themeStyle.setOption(option);
      },
    },
  };
</script>
博主致谢

非常感谢小伙伴们阅读到结尾,本期的文章就分享到这里,总结了
(vue实现echarts可视化【定制主题 + 通用写法】),希望可以帮到大家,谢谢。


