一、算法简介

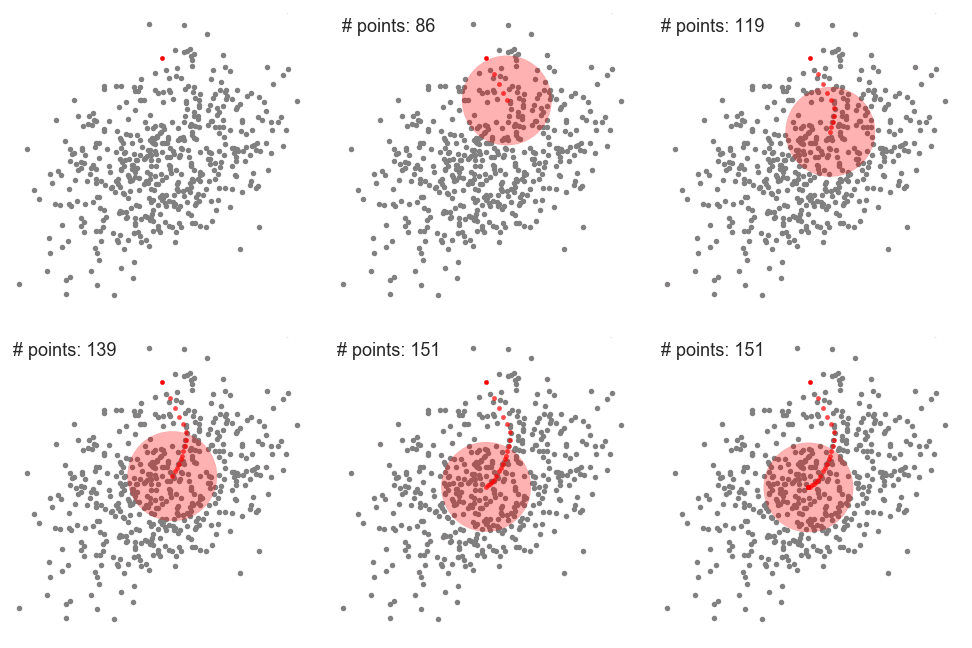
- 均值漂移算法首先找到一个中心点center(随机选择),然后根据半径划分一个范围
- 把这个范围内的点输入簇c的标记个数加1
- 在这个范围内,计算其它点到这个点的平均距离,并把这个平均距离当成偏移量 shift
- 把中心点center移动偏移量 shift 个单位,当成新的中心点
- 重复上述步骤直到 shift小于一定阈值,即收敛
- 如果当前簇c的center和另一个簇c2的center距离小于一定阈值,则把当前簇归类为c2,否则聚类的类别+1
- 重复1、2、3、4、5、6直到所有点都遍历过
- 如果一个点既被簇c1遍历过,也被簇c2遍历过,则把其归类为标记数多的簇
根据上述描述均值漂移聚类也就是根据密度来聚类的,样本会属于密度最大的那个类别的簇
二、一些计算
1、基础偏移量

- Sh为球半径内的点集合
- 也就是用集合内的点与质心相减得到累计的偏移量
2、高斯偏移量
- 在基础偏移量计算中,集合范围内距离簇心越远的点拥有越大的权重,这不合理
- 距离簇心越近的点应该跟簇心的类别越接近,因此此类的点应该有更大的权重

3、更新新的质心为

三、Code
1 from scipy.spatial import distance
 2 from sklearn.neighbors import NearestNeighbors
 3 from sklearn.cluster.dbscan_ import DBSCAN
 4 from sklearn.cluster.dbscan_ import dbscan
 5 import numpy as np
 6 from matplotlib import pyplot as plt
 7 from sklearn.cluster import MeanShift, estimate_bandwidth
 8
 9 from sklearn.cluster.tests.common import generate_clustered_data
10
11 min_samples = 10
12 eps = 0.0309
13
14 X = generate_clustered_data(seed=1, n_samples_per_cluster=1000)
15
16 #quantile 控制是否同一类别的距离
17 bandwidth = estimate_bandwidth(X, quantile=0.3, n_samples=len(X))
18 meanshift = MeanShift(bandwidth=bandwidth, bin_seeding=True)  # 构建对象
19 meanshift.fit(X)
20 labels = meanshift.labels_
21
22 print(np.unique(labels))
23
24 fig, ax = plt.subplots()
25 cluster_num = len(np.unique(labels))  # label的个数,即自动划分的族群的个数
26 for i in range(0, cluster_num):
27     x = []
28     y = []
29     for ind, label in enumerate(labels):
30         if label == i:
31             x.append(X[ind][0])
32             y.append(X[ind][1])
33     ax.scatter(x, y, s=1)
34
35 plt.show()
结果


