
G6是我们现在比较常用的可视化图形插件,各种图形也比较丰富,但是各种各样的业务场景,就还是需要我们去自定义才能实现想要的功能。比如我最近做的需求,业务场景是,一个中心任务,有向下扩展的任务,也有向上依赖的任务,并且有可能相互依赖。我的实现思路是,使用层级布局,自定义节点,层次布局的官方介绍详情可看官网:https:///zh/docs/api/graphLayout/dagre
实现的效果如下:
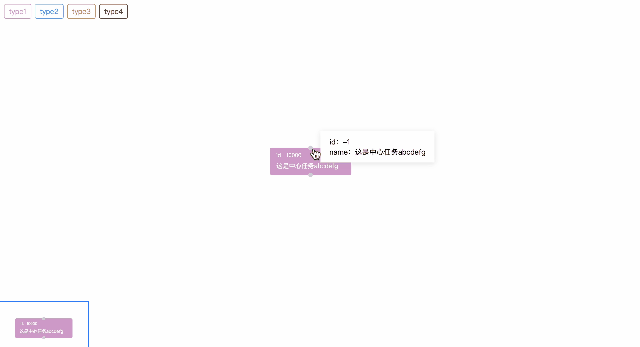
交互:在点击原点的时候请求后端接口展开或收起。
中间实现的关键点是每个节点的所有父级和子级的id的处理。具体代码:
<!DOCTYPE html>
<html lang="en">
<head>
  <meta charset="UTF-8">
  <meta http-equiv="X-UA-Compatible" content="IE=edge">
  <meta name="viewport" content="width=device-width, initial-scale=1.0">
  <script src="https://gw.alipayobjects.com/os/lib/antv/g6/3.8.5/dist/g6.min.js"></script>
  <title>Document</title>
</head>
<style>
  #container {
    width: 100%;
    height: 100vh;
    display: flex;
    flex-direction: column;
    overflow: hidden;
  }
  .color-tip-container {
    display: flex;
    padding: 12px;
  }
  .color-tip-item {
    margin-right: 8px;
    padding: 4px 10px;
    border-radius: 4px;
  }
</style>
<body>
  <div id="container">
    <div class="color-tip-container">
      <div class="color-tip-item" style="color: #d5a4cf;border: 1px solid #d5a4cf">type1</div>
      <div class="color-tip-item" style="color: #41b6e6;border: 1px solid #41b6e6">type2</div>
      <div class="color-tip-item" style="color: #e1982f;border: 1px solid #e1982f">type3</div>
      <div class="color-tip-item" style="color: #7c4326;border: 1px solid #7c4326">type4</div>
    </div>
    <div id="chartView"></div>
  </div>
</body>
<script>
  const container = document.getElementById('chartView');
  const curTaskNode = {
    id: '-1',
    taskId: '10000',
    name: '这是中心任务abcdefg',
    level: 'base', // base, parent, child
    textColor: '#d5a4cf',
    hasParent: true, // 默认有父节点
    hasChild: true, // 默认有子节点
    parentCollapse: true, // 父节点是否折叠
    childCollapse: true, // 子节点是否折叠
    childIds: [],
    parentIds: [],
  };
  // 不同类型的块的颜色设置
  const colorData = {
    1: {
      textColor: '#d5a4cf',
    },
    2: {
      textColor: '#41b6e6',
    },
    3: {
      textColor: '#e1982f',
    },
    4: {
      textColor: '#7c4326',
    },
  };
  autoIncrementId = 1; // 自增id,这里是因为前端mock数据,所以使用,正常情况下这个id由后端数据提供
  nodesData = []; // 所有的节点集合
  edgesData = []; // 边数据
  // 随机取[1, 4]的正整数
  const getRandomIntInclusive = (min = 1, max = 4) => {
    min = Math.ceil(min);
    max = Math.floor(max);
    return Math.floor(Math.random() * (max - min + 1)) + min; //含最大值,含最小值
  }
  // 得到目标数组中除了当前数组以外的数组
  const getDiffData = (originArr, targetArr) => {
    const diffArr = [];
    originArr.forEach(item => {
      if (!targetArr.includes(item)) {
        diffArr.push(item);
      }
    });
    return diffArr;
  }
  /**
   * 点击收起/展开的事件
   * @param {*} evtName 节点名称
   * @param {*} model 当前点击的数据模型
   */
  const updateGraph = (evtName, model) => {
    let newNodesData = []; // 新的节点数据
    let newEdgesData = []; // 新的边数据
    if (evtName === 'p-marker') {
      if (model.parentCollapse) { // 目前是折叠状态,需要展开
        newEdgesData = [].concat(edgesData);
        const newAddNodes = [];
        const newIds = [];
        for (let i = 0; i < 2; i++) { // 固定添加两条数据,之后改成请求
          // newNodesData[curNodeIndex].parentIds.push(String(autoIncrementId));
          newIds.push(String(autoIncrementId));
          const randomType = getRandomIntInclusive();
          console.log(randomType, 'randomType');
          const colorItem = colorData[randomType];
          newAddNodes.push({
            id: String(autoIncrementId),
            name: `测试新增父name${autoIncrementId}`,
            taskId: `10000${autoIncrementId}`,
            parentIds: [],
            childIds: model.childIds.concat([]),
            level: 'parent',
            hasChild: true,
            hasParent: true,
            parentCollapse: true,
            childCollapse: false,
            textColor: colorItem.textColor,
          });
          newEdgesData.push({
            target: ,
            source: String(autoIncrementId)
          });
          autoIncrementId ++;
        }
        const curNodeIndex = nodesData.findIndex(item => item.id === ); // 当前点击的节点在节点数据中的下标
        nodesData[curNodeIndex].parentCollapse = false;
        nodesData[curNodeIndex].parentIds = nodesData[curNodeIndex].parentIds.concat(newIds);
        nodesData.concat(newAddNodes).forEach(node => {
          if (model.childIds.includes(node.id)) {
            node.parentIds = node.parentIds.concat(newIds);
          }
          newNodesData.push(node);
        });
      } else { // 目前是展开状态,需要折叠
        // 所有以当前的所有父节点为源头的箭头指向的箭头都要去掉
        newEdgesData = edgesData.filter(edge => !model.parentIds.includes(edge.source));
        nodesData.forEach(node => {
          if (!node.childIds.includes()) { // 所有子节点中有当前节点的节点都要去掉,并且留下的父节点也要去掉要删除的节点数据
            node.parentIds = getDiffData(node.parentIds, model.parentIds);
            newNodesData.push(node);
          }
        });
        const curNodeIndex = newNodesData.findIndex(item => item.id === ); // 当前点击的节点在节点数据中的下标
        newNodesData[curNodeIndex].parentCollapse = true;
      }
    } else if (evtName === 'c-marker') {
      if (model.childCollapse) { // 目前是折叠状态,需要展开
        newEdgesData = [].concat(edgesData); // 边数据
        const newAddNodes = []; // 新增加的子节点数据
        const newIds = [];
        for (let i = 0; i < 2; i++) { // 固定添加两条数据,之后改成请求
          newIds.push(String(autoIncrementId));
          const colorItem = colorData[getRandomIntInclusive()];
          newAddNodes.push({
            id: String(autoIncrementId),
            name: `测试新增子name${autoIncrementId}`,
            taskId: `10000${autoIncrementId}`,
            parentIds: model.parentIds.concat([]),
            childIds: [],
            level: 'child',
            hasChild: true,
            hasParent: true,
            parentCollapse: false,
            childCollapse: true,
            textColor: colorItem.textColor,
          });
          newEdgesData.push({
            target: String(autoIncrementId),
            source:
          });
          autoIncrementId ++;
        }
        const curNodeIndex = nodesData.findIndex(item => item.id === ); // 当前点击的节点在节点数据中的下标
        nodesData[curNodeIndex].childCollapse = false;
        nodesData[curNodeIndex].childIds = nodesData[curNodeIndex].childIds.concat(newIds);
        nodesData.concat(newAddNodes).forEach(node => {
          if (model.parentIds.includes(node.id)) {
            node.childIds = node.childIds.concat(newIds);
          }
          newNodesData.push(node);
        });
      } else { // 目前是展开状态,需要折叠
        // 去掉所有以当前的所有子节点中任意一个为目标点的箭头
        newEdgesData = edgesData.filter(edge => !model.childIds.includes(edge.target));
        nodesData.forEach(node => {
          if (!node.parentIds.includes()) {
            node.childIds = getDiffData(node.childIds, model.childIds);
            newNodesData.push(node);
          }
        });
        const curNodeIndex = newNodesData.findIndex(item => item.id === ); // 当前点击的节点在节点数据中的下标
        newNodesData[curNodeIndex].childCollapse = true;
      }
    }
    nodesData = newNodesData;
    edgesData = newEdgesData;
    console.log('newNodesData--🌈🌈', newNodesData);
    console.log('newEdgesData--🌧️🌧️', newEdgesData);
    graphObj.changeData({ nodes: newNodesData, edges: newEdgesData});
    graphObj.fitCenter();
  }
  // 初始化节点/边
  const initGraphData = () => {
    G6.registerNode(
      'dispatch-rect',
      {
        drawShape: (cfg, group) => {
          const {
            name = '',
            taskId = '',
            level = '',
            hasParent = false,
            hasChild = false,
            textColor
          } = cfg;
          // 矩形框
          const rectConfig = {
            x: -90,
            y: -30,
            width: 180,
            height: 60,
            lineWidth: 1,
            fontSize: 12,
            fill: level === 'base' ? textColor : '#fff',
            radius: 4,
            opacity: 1,
            stroke: textColor,
          };
          const rect = group.addShape('rect', {
            attrs: {
              ...rectConfig,
            },
          });
          // 当前事件id
          group.addShape('text', {
            attrs: {
              x: -76,
              y: -8,
              text: `id:${taskId}`,
              fontSize: 12,
              fill: level === 'base' ? '#fff' : textColor,
              cursor: 'pointer',
            },
            name: 'id-text',
          });
          // 当前事件名称
          group.addShape('text', {
            attrs: {
              x: -76,
              y: 10,
              text: name.length > 14 ? `${name.substring(0, 14)}...` : name,
              fontSize: 14,
              fill: level === 'base' ? '#fff' : textColor,
              cursor: 'pointer',
              textBaseline: 'middle',
            },
            name: 'name-text',
          });
          // 操作上级的marker
          if ((level === 'base' || level === 'parent') && hasParent) {
            group.addShape('circle', {
              attrs: {
                x: 0,
                y: -30,
                r: 5,
                fill: '#dadada',
                cursor: 'pointer',
              },
              name: 'p-marker',
            });
          }
          // 操作下级的marker
          if ((level === 'base' || level === 'child') && hasChild) {
            group.addShape('circle', {
              attrs: {
                x: 0,
                y: 30,
                r: 5,
                fill: '#dadada',
                cursor: 'pointer',
              },
              name: 'c-marker',
            });
          }
          return rect;
        },
        // update: (cfg, item) => {
        //   console.log(cfg, 'cfg updated', item);
        // }
      },
      'rect'
    );
    G6.registerEdge('flow-line', {
      draw(cfg, group) {
        const startPoint = cfg.startPoint;
        const endPoint = cfg.endPoint;
        const { style } = cfg;
        const shape = group.addShape('path', {
          attrs: {
            stroke: style.stroke,
            endArrow: style.endArrow,
            path: [
              ['M', startPoint.x, startPoint.y],
              ['L', startPoint.x, (startPoint.y + endPoint.y) / 2],
              ['L', endPoint.x, (startPoint.y + endPoint.y) / 2],
              ['L', endPoint.x, endPoint.y],
            ],
          },
        });
        return shape;
      },
    });
  }
  // 绘制
  const initDraw = () => {
    const parentContainer = document.getElementById('container');
    const width = parentContainer.offsetWidth - 40;
    const height = parentContainer.offsetHeight - 180 || 500;
    const minimap = new G6.Minimap();
    const graph = new G6.Graph({
      container: container,
      width,
      height,
      plugins: [minimap],
      layout: {
        type: 'dagre',
        nodesep: 60,
        ranksep: 40,
        controlPoints: true,
      },
      defaultNode: {
        type: 'dispatch-rect',
        anchorPoints: [[0.5, 0],[0.5, 1]],
      },
      defaultEdge: {
        type: 'flow-line',
        style: {
          stroke: '#dadada',
          endArrow: {
            path: G6.Arrow.triangle(),
            fill: '#dadada'
          }
        }
      },
      nodeStateStyles: {
        selected: {
          stroke: '#d9d9d9',
          fill: '#5394ef',
        },
      },
      modes: {
        default: [
          'drag-canvas',
          'zoom-canvas',
          {
            type: 'tooltip',
            formatText(model) {
              const { id, name } = model;
              return `<div style="background: #fff;padding: 12px 20px;box-shadow: 0 2px 12px 0 rgb(0 0 0 / 10%)">
                id:${id}<br/>
                name:${name}
              </div>`;
            },
            offset: 30,
          },
        ],
      },
      fitCenter: true,
    });
    nodesData.push(curTaskNode);
    graph.data({ nodes: [ curTaskNode ], edges: [] });
    graph.render();
    graph.on('node:click', evt => {
      // 在注册节点的时候每个图形都有个name属性,可以根据name属性确定用户点击的事具体哪个图形,进行相应的操作
      const name = evt.target.get('name');
      if (name === 'name-text') { // 跳转case
        window.open('https:///zh', '_blank')
      } else if (name === 'p-marker' || name === 'c-marker') {
        const model = evt.item.getModel();
        updateGraph(name, model);
      }
    })
    graphObj = graph;
  }
  initGraphData();
  initDraw();
  if (typeof window !== 'undefined') {
    window.onresize = () => {
      if (!graphObj || graphObj.get('destroyed')) return;
      if (!container || !container.scrollWidth || !container.scrollHeight) return;
      graphObj.changeSize(container.scrollWidth, container.scrollHeight);
    };
  }
</script>

</html>
本文章为转载内容,我们尊重原作者对文章享有的著作权。如有内容错误或侵权问题,欢迎原作者联系我们进行内容更正或删除文章。


