
ProcDump与Procexp一样是Windows平台上的内部调试工具,Procexp采用图形界面体现系统整体及个别进程的性能信息,而ProcDump则与我们在Unix平台上使用的性能分析工具类似使用CLI命令行界面。
Procdump目前的版本号为3.04,可以从其Homepage上下载到该工具,该监控软件由Mark Russinovich开发,是一款Free Software。其官方介绍如下:
ProcDump is a command-line utility whose primary purpose is monitoring an application for
CPU spikes and generating crash dumps during a spike that an administrator or developer can use to
determine the cause of the spike. ProcDump also includes hung window monitoring
(using the same definition of a window hang that Windows and Task Manager use),
unhandled exception monitoring and can generate dumps based on the values of system performance counters.
It also can serve as a general process dump utility that you can embed in other scripts.
Procdump可以用于监控应用进程的CPU峰值,并在峰值阶段生成crash dump转储信息,其功能还包括:
- 监控hang住的窗口
- 可以为未处理的意外(unhandled exceptions)生成dump
- 基于系统性能计数器(system performance counters)生成dump
- 因为Procdump是基于命令行的,所以它可以被嵌入在脚本中
   -64     By default Procdump will capture a 32-bit dump of a 32-bit process
           when running on 64-bit Windows. This option overrides to create a
           64-bit dump.
   -b      Treat debug breakpoints as exceptions (otherwise ignore them).
   -c      CPU threshold at which to create a dump of the process.
   -e      Write a dump when the process encounters an unhandled exception.
           Include the 1 to create dump on first chance exceptions.
   -h      Write dump if process has a hung window (does not respond to
           window messages for at least 5 seconds).
   -m      Memory commit threshold in MB at which to create a dump of the
           process.
   -ma     Write a dump file with all process memory. The default
           dump format includes thread and handle information.
   -mp     Write a dump file with thread and handle information, and all
           read/write process memory. To minimize dump size, memory areas
           larger than 512MB are searched for, and if found, the largest
           area is excluded. A memory area is the collection of same
           sized memory allocation areas. The removal of this (cache)
           memory reduces Exchange and SQL Server dumps by over 90%.
   -n      Number of dumps to write before exiting.
   -o      Overwrite an existing dump file.
   -p      Trigger on the specified performance counter when the threshold
           is exceeded. Note: to specify a process counter when there are
           multiple instances of the process running, use the process ID
           with the following syntax: "\Process(_)\counter"
   -r      Reflect (clone) the process for the dump to minimize the time
           the process is suspended (Windows 7 and higher only).
   -s      Consecutive seconds before dump is written (default is 10).
   -t      Write a dump when the process terminates.
   -u      Treat CPU usage relative to a single core.
   -x      Launch the specified image with optional arguments.
以下为常见的Procdump使用示例:
To just create a dump of a running process, omit the CPU threshold. If
you omit the dump file name, it defaults to _.dmp.

Example: Write up to 3 dumps of a process named 'consume' when it exceeds
         20% CPU usage for five seconds to the directory
         c:\dump\consume with the name consume.dmp:
            C:\>procdump -c 20 -s 5 -n 3 -o consume c:\dump\consume
Example: Write a dump for a process named 'hang.exe' when one of it's
         windows is unresponsive for more than 5 seconds:
            C:\>procdump -h hang.exe hungwindow.dmp
Example: Write 3 dumps 5 seconds apart:
            C:\>procdump -s 5 -n 3 notepad.exe notepad.dmp
Example: Launch a process and then monitor it for excessive CPU usage:
            C:\>procdump -c 30 -s 10 -x consume.exe consume.dmp
Example: Write a dump of a process named 'iexplore' to a dump file
         that has the default name iexplore.dmp:
            C:\>procdump iexplore
Example: Write a dump of a process named 'outlook' when total system
         CPU usage exceeds 20% for 10 seconds:
            C:\>procdump outlook -p "\Processor(_Total)\% Processor Time" 20
Example: Write a dump of a process named 'outlook' when Outlook's handle count
         exceeds 10000:
            C:\>procdump outlook -p "\Process(Outlook)\Handle Count" 10000
具体使用Procdump监控Oracle进程的方法:
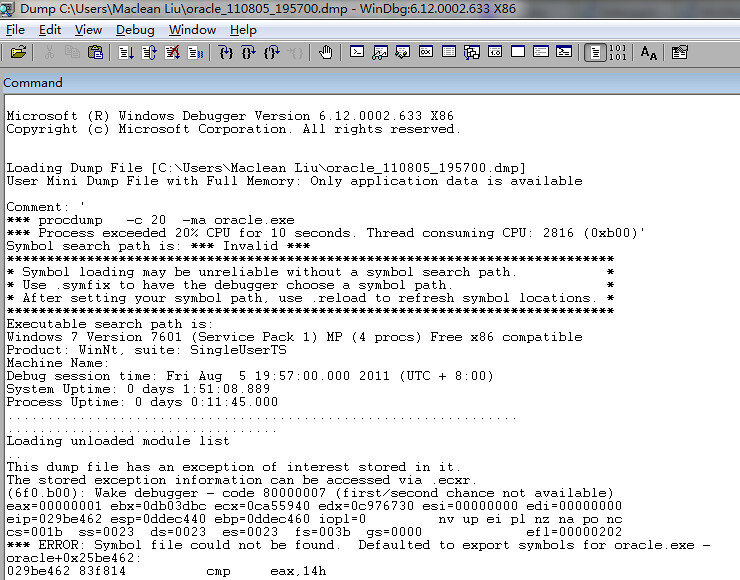
在我们的场景中某个服务线程消耗了大量的CPU资源: Terminal A: sqlplus / as sysdba SQL> select count(1) from obj$,obj$,obj$; Terminal B: C:\Users\Maclean Liu>procdump -c 20 -ma oracle.exe ProcDump v3.04 - Writes process dump files Copyright (C) 2009-2011 Mark Russinovich Sysinternals - www.sysinternals.com Process: oracle.exe (1776) CPU threshold: 20% of system Performance counter: n/a Commit threshold: n/a Threshold seconds: 10 Number of dumps: 1 Hung window check: Disabled Exception monitor: Disabled Terminate monitor: Disabled Dump file: C:\Users\Maclean Liu\oracle.dmp [19:56.51] CPU: 25% 1s [19:56.52] CPU: 24% 2s [19:56.53] CPU: 24% 3s [19:56.54] CPU: 25% 4s [19:56.55] CPU: 24% 5s [19:56.56] CPU: 24% 6s [19:56.57] CPU: 24% 7s [19:56.58] CPU: 25% 8s [19:56.59] CPU: 24% 9s [19:57.00] CPU: 25% 10s Process has hit CPU spike threshold. Writing dump file C:\Users\Maclean Liu\oracle_110805_195700.dmp ... Dump written. Dump count reached. 因为Oracle.exe的cpu峰值达到了我们所设置的20,所以产生了进程dump转储文件oracle_110805_195700.dmpWindbg是windows平台上的图形化dump分析工具,可以通过安装Debugging Tools for Windows包获得该程序,或者直接点击这里下载。 成功安装debugging工具后,从start->Debugging Tools for Windows (x86)->windbg启动工具,在主界面上选中File->Open Crash Dump 并输入dump文件的位置,成功分析后的显示:


