
Whether you are a new VMware Admin or you have some experience, you may not know what you should be checking, each day, in your VMware vSphere environment to ensure that things are running as they should. Unless you look each day (or have a daily performance/capacity tool do it for you), you may take a periodic glance at performance, let’s say, and have no idea “what’s normal”. Unless a big red siren is going off, chances are, the infrequent admins wouldn’t recognize if, overnight, memory utilization (for example) had increased by 80% utilization and applications were suffering – simply because they didn’t know what to look for.
Here are the top 5 daily checks that every VMware Admin should look at, each day:
#1 Events and Tasks
The vCenter hosts and VMs inventory is organized in a hierarchical manor where the higher you go in the inventory, the more and more information you get about the objects below. Thus, at the lowest level (say, the VM level), you’ll only get information about the VM. On the other hand, at the highest level (the vCenter server level), you’ll get information about every object in the inventory (datacenters, clusters, hosts, resource pools, and VMs).
The tasks and events tab on each of the objects in the vCenter inventory will tell you what tasks were initiated (their results and who initiated them) as well as events that happened (their results and who initiated them). Tasks are things that you initiate (as an admin) and events are results of tasks (sub tasks) or system-initiated events.
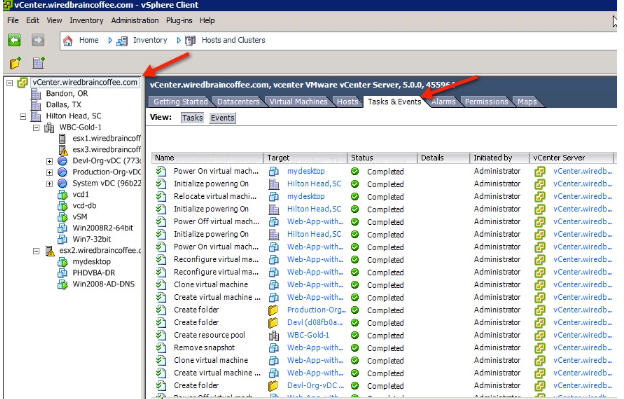
Figure 1 – vSphere Tasks and Events at the vCenter Level
You can sort the columns to show the type and status you are looking for on the top. For example, here you can see all the events that had warnings are shown first:
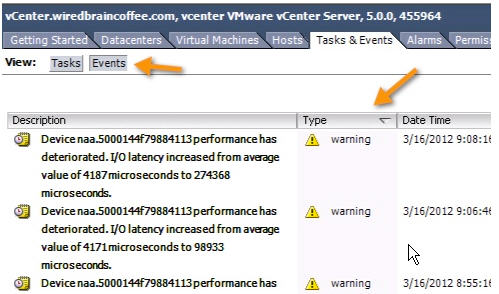
Figure 2 – vSphere Tasks and Events at the vCenter Level
#2 vCenter Alarms
By default, vCenter has 50+ alarms defined when installed. These alarms could alert you to all sorts of things such as high memory utilization on an ESXi host.
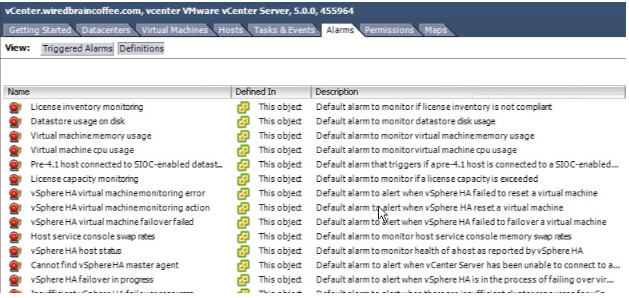
Figure 3 – vCenter’s Default Alarms
The problem with these alarms is that, by default, they take no action other than a warning or alert in the vSphere Client. By default, they send no email or other notification. Thus, if you don’t have the vSphere client open and if you don’t check for them, you will never know that your virtual infrastructure is in trouble.
So, you either need to go in and check for triggered alarms at the highest level, each day, go in and configure each alarm to notify you via email (or another option like a SNMP trap to your infrastructure monitoring system) or use a third-party tool.
One of the free tools that I like for alarm monitoring is Xtravirt’s free vAlarm. It has a desktop balloon popup for any triggered alarm, without you having to configure a notification for each of the alarms in vCenter.
#3 Storage Latency & Capacity
While memory is highly utilized in a virtual infrastructure, storage IOPS (I/Os per second) is usually the second hardest hit resource. And, even if there is plenty of memory, storage performance can always be a bottleneck.
You need to monitor storage latency to ensure that there isn’t too much delay for your ESXi hosts to access their storage where virtual machines and virtual machine swap files are located. If there is too much delay (latency) then applications in those VMs will slow down. Unfortunately, I haven’t found a quick way in the vSphere Client GUI to check storage latency without going into each of your datastores in the Datastores inventory and clicking on the Performance tab. For example, here is the average write latency per virtual machine.
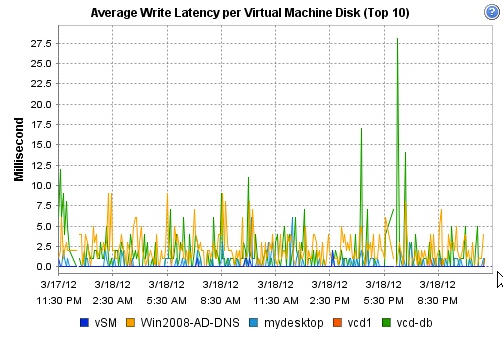
Figure 4 – Average Write Latency per VM
Instead of monitoring storage latency through the vSphere Client, a nice free tool for storage latency monitoring is vKernel’s Capacity View that shows high storage latency (and other performance capacity issues). Alternatively, third-party tools like VMware vCenter Operations Suite (vCOPS) and vKernel’s vOPS.
Storage capacity, on the other hand, is very easy to monitor. The overview screen on the performance tab for datastores, under the storage inventory, is a good resource for storage capacity monitoring.
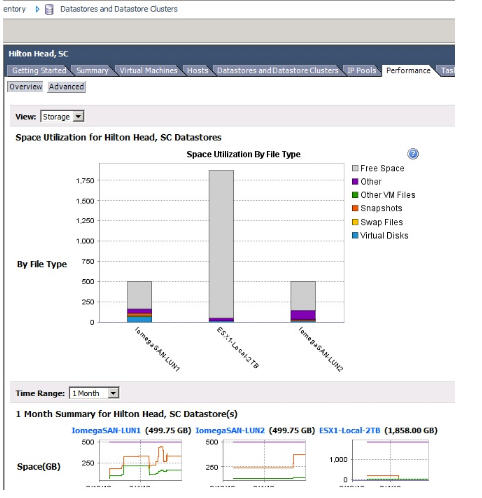
Figure 5 – Storage Capacity Monitoring
#4 Cluster Memory Utilization
You’ll get the most out of your virtual infrastructure by using a DRS/HA cluster. That cluster will pool (and load-balance, to some degree) your CPU and memory from all ESXi servers in the cluster. Once placed in a cluster, you need to keep an eye on your cluster memory and CPU utilization (no longer do you need to monitor CPU and memory on individual hosts).
To monitor cluster memory utilization, go to the cluster level and to the performance tab.
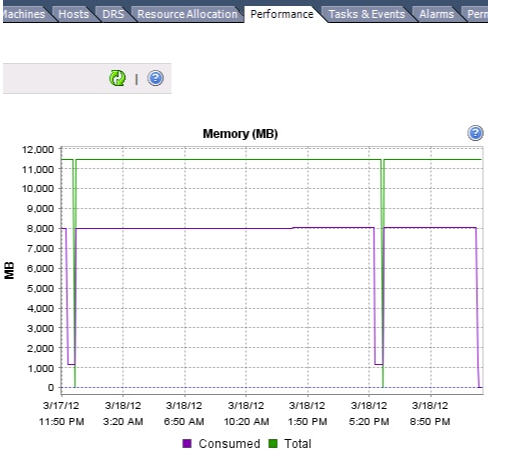
Figure 6 – Monitoring Cluster Memory Utilization
#5 Cluster CPU Utilization
Just like cluster memory utilization, you need to monitor cluster CPU utilization. You want to maintain enough capacity for virtual machines to burst when needed, for virtual machines to be added, or for a host to fail in the VMHA cluster and the VMs to be restarted on remaining hosts.
To monitor cluster CPU utilization, go to the cluster level, to the performance tab, and then view the CPU graph in the overview view:
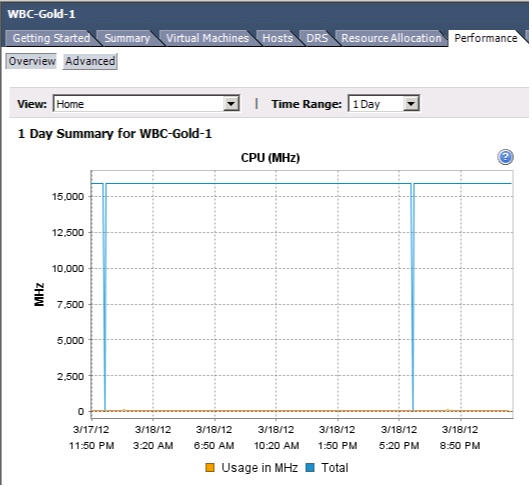
Figure 7 – Monitoring Cluster CPU Utilization
Summary
As a VMware Admin, you never want to have an outage on your watch. In just a few minutes per day, you can make sure that your virtual infrastructure is running as it should and prevent problems before they happen.


